

Break of Structure (BOS) Explained: Definition, Types & Strategy
A break of structure (BOS) is a market structure signal that confirms trend continuation. Learn what it is, how to identify bullish and bearish BOS, and how traders use it.

A break of structure (BOS) is a market structure event that confirms a trend is continuing in its current direction. A bullish BOS confirms an uptrend is intact. A bearish BOS confirms a downtrend is intact. Traders use BOS not as an entry signal but as confirmation to hold or add to an existing position.
BOS is a core concept in Smart Money Concepts (SMC) trading. Understanding it requires a basic grasp of market structure: how price creates higher highs and higher lows in an uptrend, and lower highs and lower lows in a downtrend.
How to Identify a BOS
A BOS is identified by looking at the sequence of swing highs and lows on a chart. Each new swing confirms whether the trend is continuing or losing momentum.
Bullish BOS
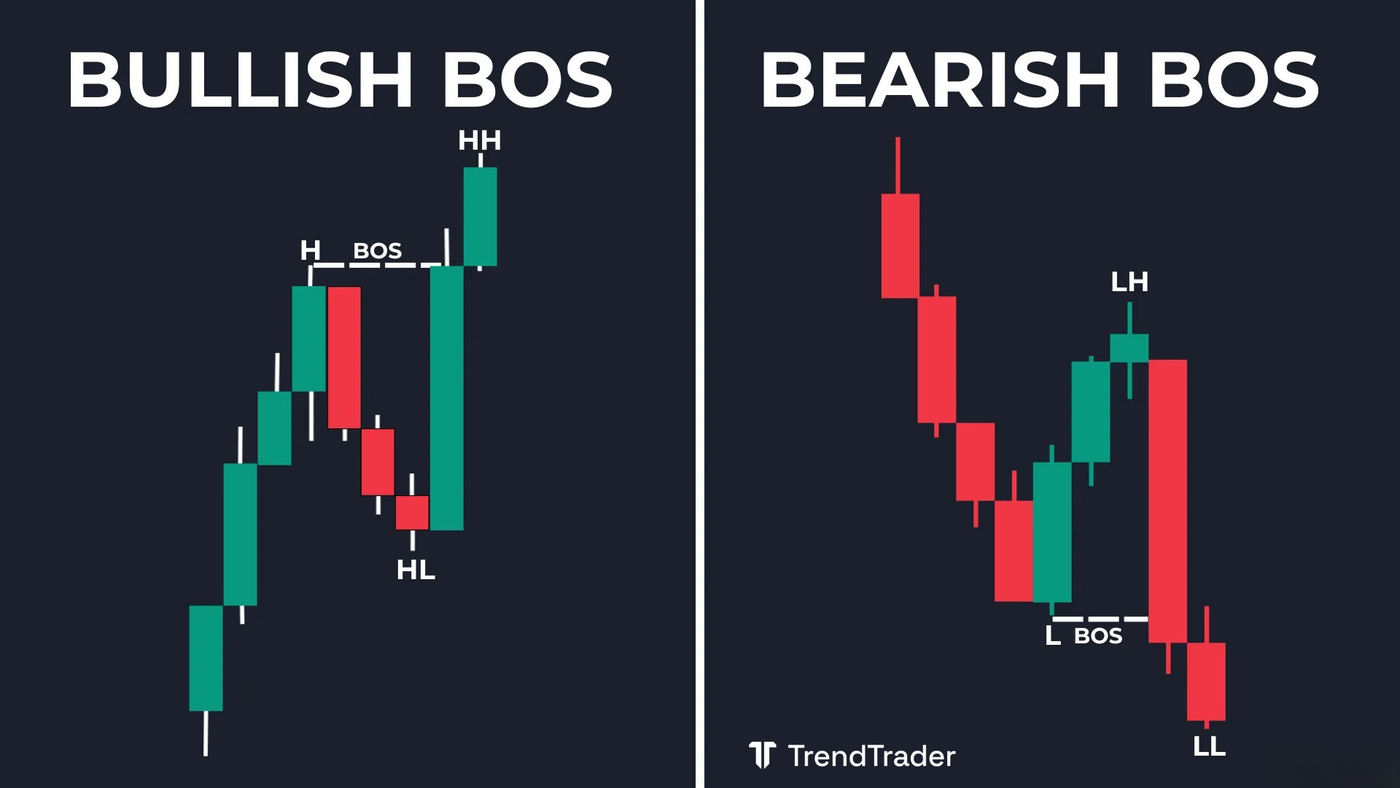
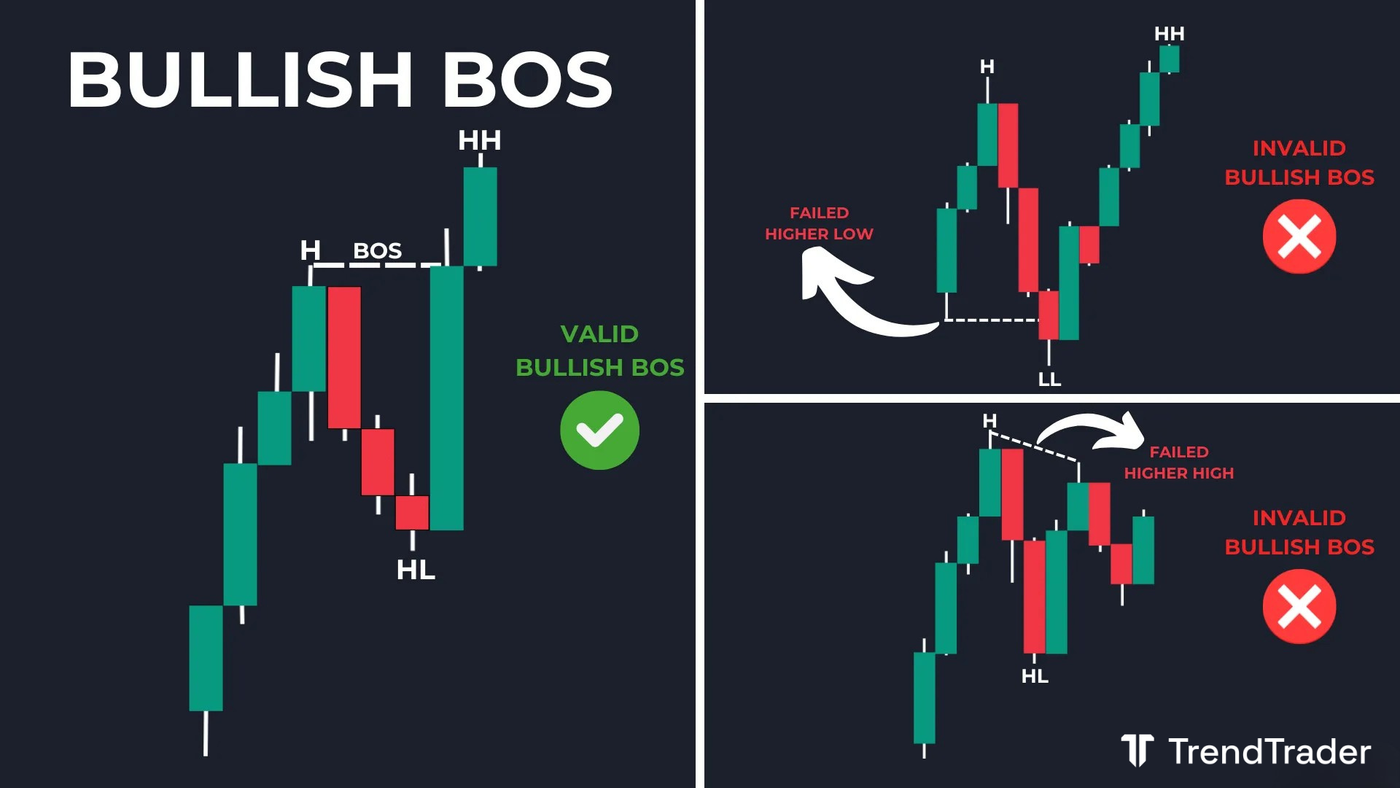
A bullish BOS forms when price creates a higher low (HL) followed by a higher high (HH). The higher low shows that buyers stepped in at a higher level than before, unwilling to let price fall as far. The higher high confirms that buyers then pushed price above the previous peak. Together, these two swing points confirm the uptrend is continuing.
A bullish BOS is invalid if price fails to make a new higher high, or if it drops below the prior higher low before breaking above the previous swing high.
Bearish BOS
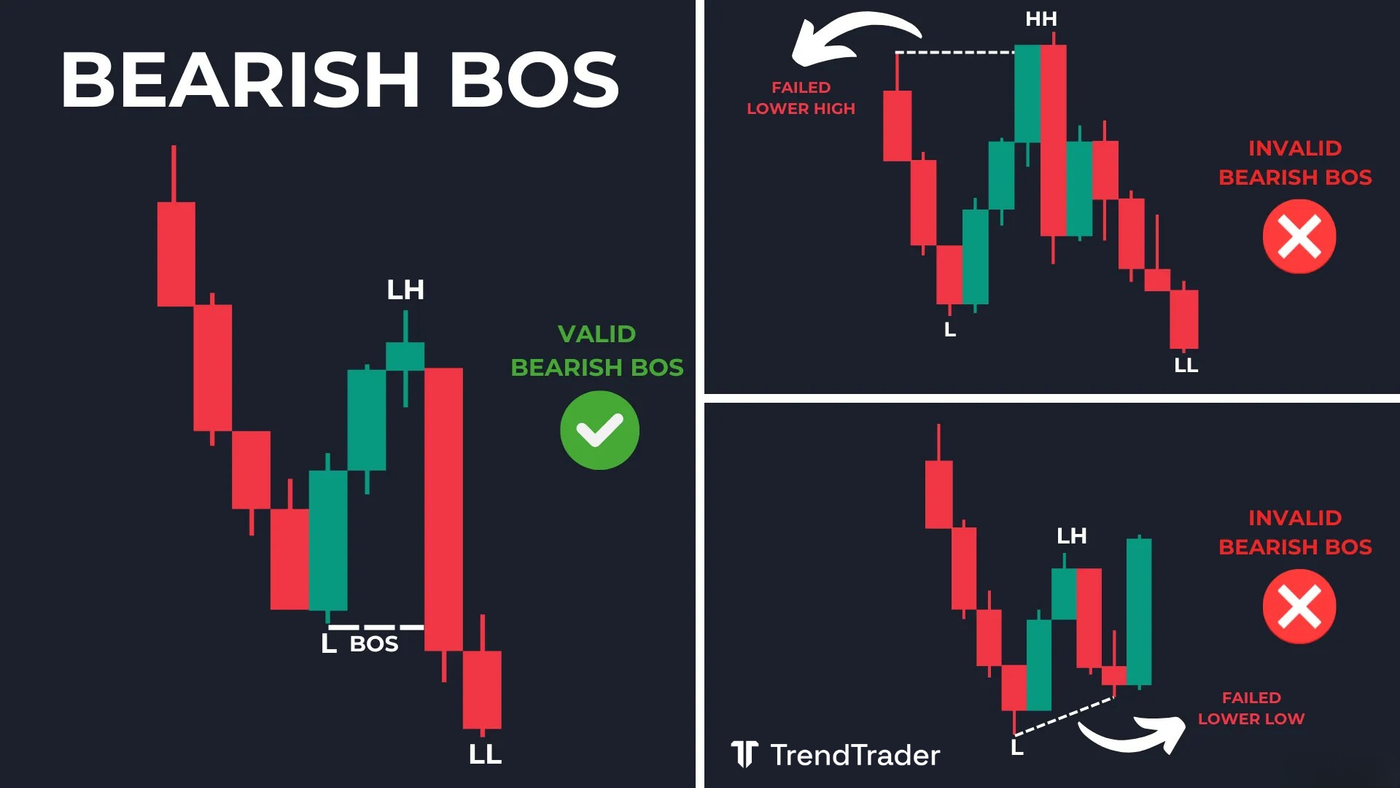
A bearish BOS forms when price creates a lower high (LH) followed by a lower low (LL). The lower high shows sellers stepping in at a lower level than before, pushing price down before it can recover its previous peak. The lower low confirms sellers are in control and the downtrend is continuing.
A bearish BOS is invalid if price fails to make a new lower low, or if it pushes above the prior lower high before breaking below the previous swing low.
Trading Using a Break of Structure (BOS)
BOS is not an entry signal. It is a confirmation tool. When a bullish BOS forms, traders already in a long position use it as a reason to stay in the trade rather than exit. When a bearish BOS forms, traders already short use it as confirmation to maintain the position.
Entering trades at a BOS alone is low-probability because by the time the BOS forms, the move has already happened. The better approach is to enter on a structural shift (like a change of character) and use subsequent BOS formations to confirm the trade is working.
Common Strategies Using BOS
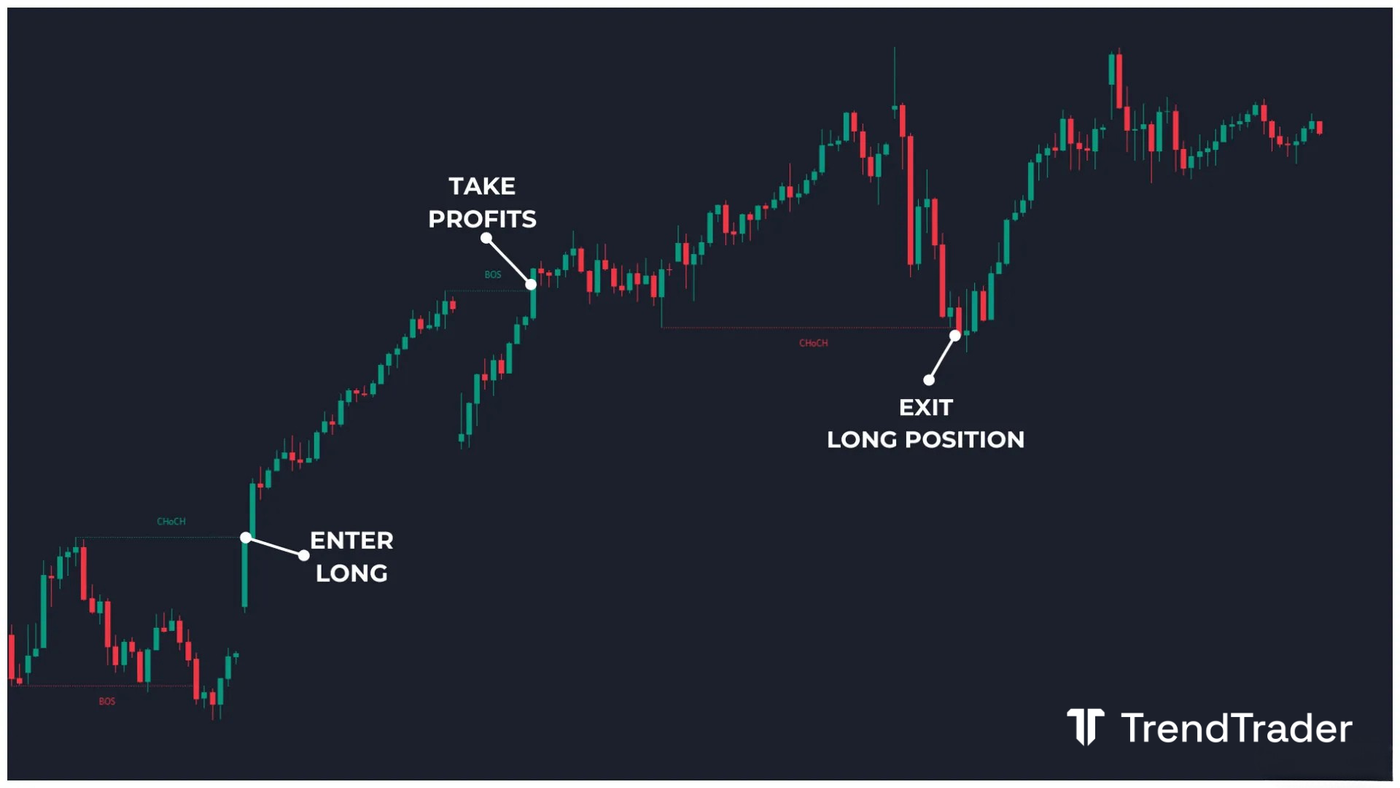
One of the most common BOS strategies combines it with a Change of Character (CHoCH). A CHoCH signals a potential shift from one trend to another. A trader will enter a long at the formation of a bullish CHoCH, expecting the prior downtrend to reverse. As price develops, a bullish BOS then forms, confirming the new uptrend is underway. The trader holds through each subsequent bullish BOS and exits when a bearish CHoCH signals the trend may be reversing, or when price reaches a key resistance zone such as a bearish fair value gap or a bearish order block.
The Theory Behind the Break of Structure (BOS)
BOS is rooted in the concept of liquidity and stop hunting. When traders enter a position, they place stops: a stop loss below their entry if long, or a take profit above if the trade has run. These clusters of stops become pools of liquidity that larger participants can target.
Here is a practical illustration. A stock is trending from $10 toward $15. Many traders have bought in and set stop losses around $13. When price temporarily pulls back toward $13, buyers who missed the initial move are waiting at that level. When the stops at $13 are triggered (creating sell orders), those waiting buyers absorb that liquidity and push price back up and through $15 to $17. The higher low ($13) and the higher high ($17) form the bullish BOS.
If price had dropped through $13 rather than holding, the BOS would not have formed. That failure would signal that buyers no longer see value above $10, making a continued uptrend unlikely. Both legs (the HL and the HH) must form for a valid bullish BOS.
What Is the Difference Between a Break of Structure (BOS) and a Market Structure Break (MSB)?
A BOS signals continuation of the current market structure. Price is doing what it has been doing: continuing the established trend.
A market structure break (MSB) signals a strong reversal of the current structure. Where a BOS says the trend is intact, an MSB says the trend is ending. An MSB is equivalent to a Change of Character Plus (CHoCH+), indicating a decisive shift in who is in control of the market.
Is Break of Structure (BOS) an ICT Concept?
BOS is primarily a Smart Money Concepts (SMC) term, not an ICT term. The two frameworks share overlapping ideas, which causes confusion. The closest ICT equivalent to a BOS is the concept of inducement: the idea that price is drawn toward liquidity before continuing in the primary direction.
What Does BOS Stand For in Trading?
BOS stands for break of structure. It describes the moment price breaks through a prior swing high (in an uptrend) or a prior swing low (in a downtrend), confirming that the current trend is continuing. It is used primarily by SMC and ICT-based price action traders.
What Are the Best Timeframes for the Break of Structure (BOS)?
BOS works across all timeframes but is most commonly applied on intraday charts. The 5-minute, 15-minute, and 30-minute timeframes are the most widely used for SMC and ICT-based strategies.
Higher timeframe BOS formations carry more weight. A bullish BOS on the daily chart is more significant than one on the five-minute, because more participants are reacting to daily structure. Top-down analysis applies here too: identify the structure direction on a higher timeframe, then use lower timeframe BOS formations to time entries and manage positions.
What Are the Best Markets for the Break of Structure (BOS)?
BOS works in any market actively traded by institutional participants. Stocks within major indices, large-cap crypto, and high-volume forex pairs all produce clean, readable structure. Thinly traded instruments produce erratic swings that make structure harder to read and BOS signals less reliable.
This article is for educational purposes only and does not constitute financial advice. Trading involves significant risk of loss. Do your own research and consult a licensed financial advisor before making any trading decisions.
Browse more trading concept guides on the TrendTrader blog.
