

Breaker Blocks (BB) Explained: Definition, Types & Strategy
A breaker block is an invalidated order block that flips into a new support or resistance zone. Learn what they are, how to find them, and how to trade them.

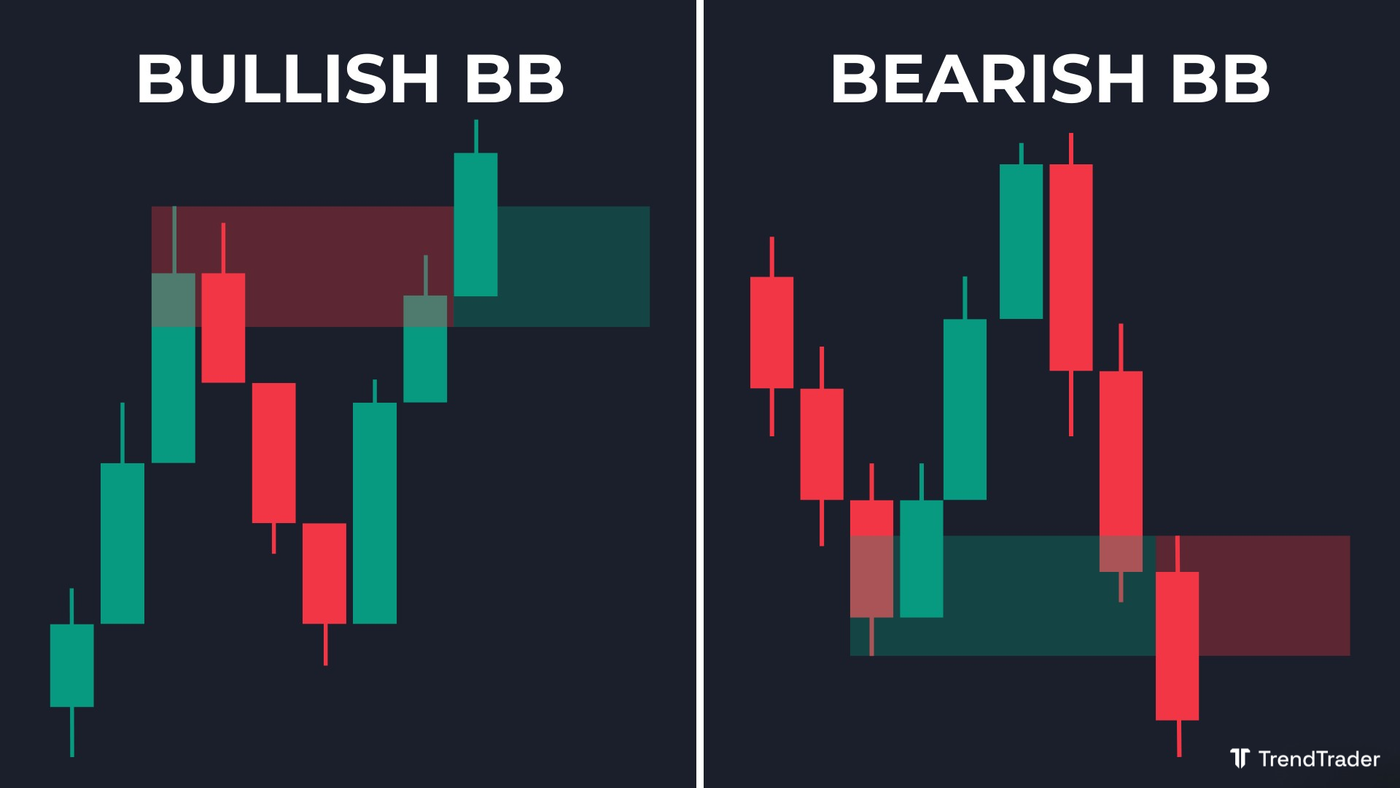
A breaker block (BB) is an invalidated order block that flips into a support or resistance zone in the opposite direction. When a bearish order block is broken to the upside, it becomes a bullish breaker block. When a bullish order block is broken to the downside, it becomes a bearish breaker block. These zones mark areas of prior institutional activity and often produce strong reactions on a retest.
Breaker blocks are a core concept in Smart Money Concepts (SMC) and ICT-based price action trading. This article covers what they are, how to identify them, how to trade them, and what makes one zone stronger than another.
What Is a Breaker Block (BB)?
A breaker block is a former order block that price has invalidated. The mechanic is similar to a broken resistance level flipping to support: once price pushes through the zone and returns to test it, the old level now plays a new role.
To understand breaker blocks, you first need to understand order blocks (OBs). An order block is a supply or demand zone formed at a swing point, typically the last candle before a strong directional move. When price returns to that zone and closes through it, the order block is invalidated. That zone does not disappear. It flips.
A bearish order block that price breaks above becomes a bullish breaker block. Look for long entries on a retest. A bullish order block that price breaks below becomes a bearish breaker block. Look for short entries on a retest.
These zones carry weight because they represent areas where significant orders were placed. The flip signals that the prior imbalance has been absorbed, and the zone may now act in reverse.
How Do You Find Breaker Blocks?
Breaker blocks form when an order block is invalidated. To find them, first identify an active order block, then watch for price to push through it.
There are two invalidation methods traders use. The wick breach: a candle wick penetrates above (for bearish OBs) or below (for bullish OBs) the zone. The candle close: a candle body closes fully above or below the zone. The candle-close method is stricter and produces fewer but higher-quality signals. Most traders prefer it for that reason.
How To Find a Bullish Breaker Block
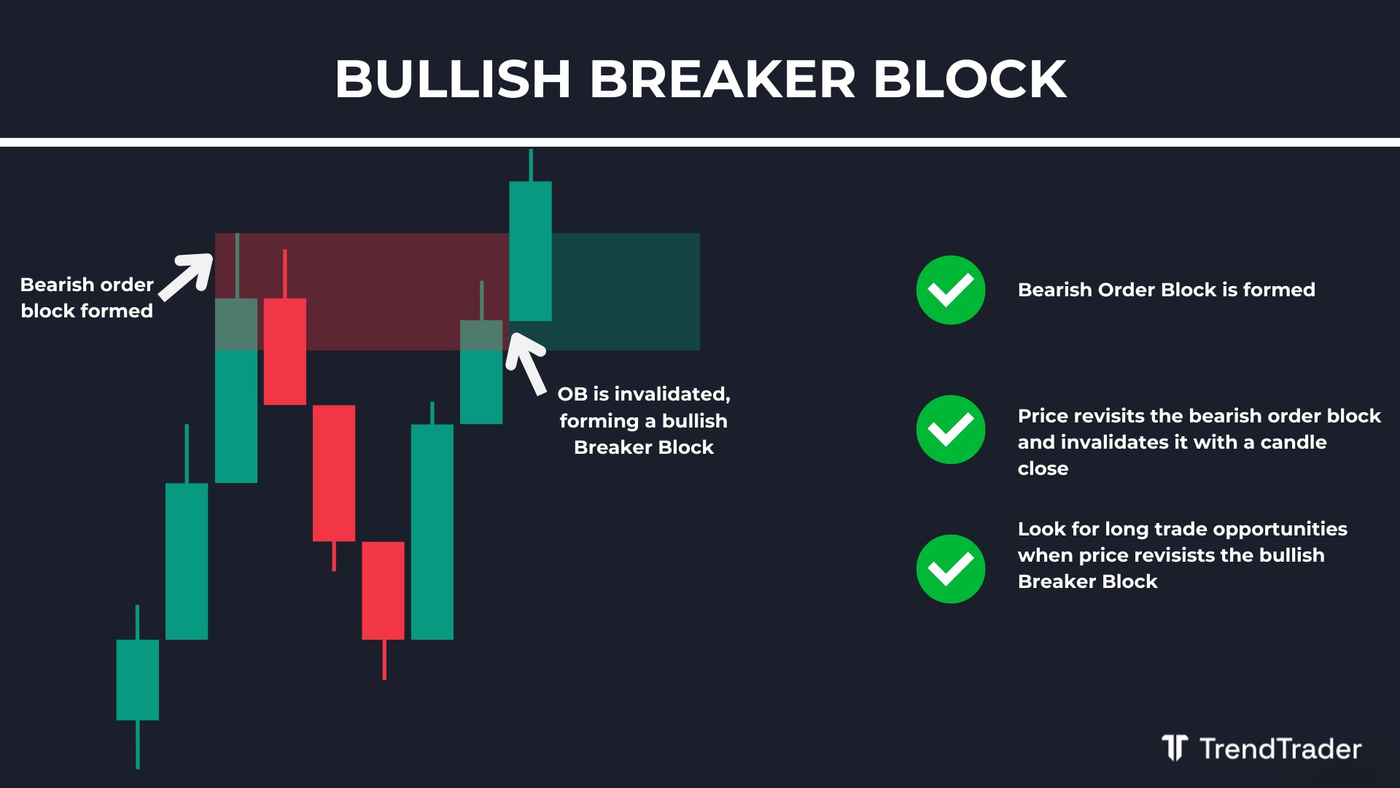
First, identify a bearish order block: the last down candle before a strong bullish impulse. Then wait for price to break back above that zone by wick or candle close. Once invalidated, the zone becomes a bullish breaker block. Look for long entries when price retests the zone from above.
How To Find a Bearish Breaker Block
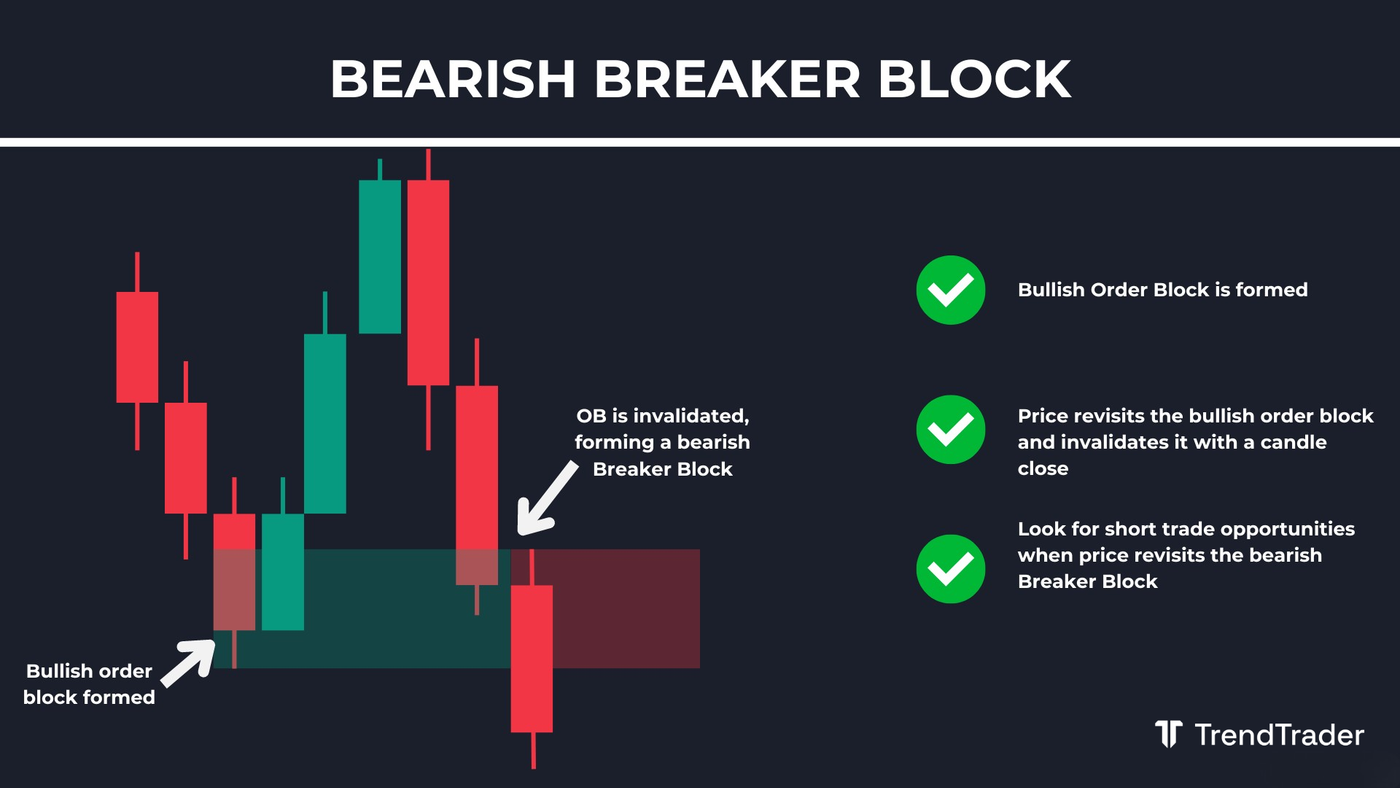
First, identify a bullish order block: the last up candle before a strong bearish impulse. Then wait for price to break back below that zone by wick or candle close. Once invalidated, the zone becomes a bearish breaker block. Look for short entries when price retests the zone from below.
How To Trade With Breaker Blocks
Breaker blocks give you a location. They do not give you a reason to enter on their own. You need confluence.
When price retests a bullish breaker block, look for long setups. When price retests a bearish breaker block, look for short setups. Entries taken without additional confirmation carry lower probability, regardless of how clean the zone looks.
Common confluence factors traders pair with breaker blocks: liquidity grabs (stop sweeps just before the move), fair value gaps (FVGs) inside or near the zone, and market structure alignment (trading with the higher-timeframe trend).
Long Trade Example
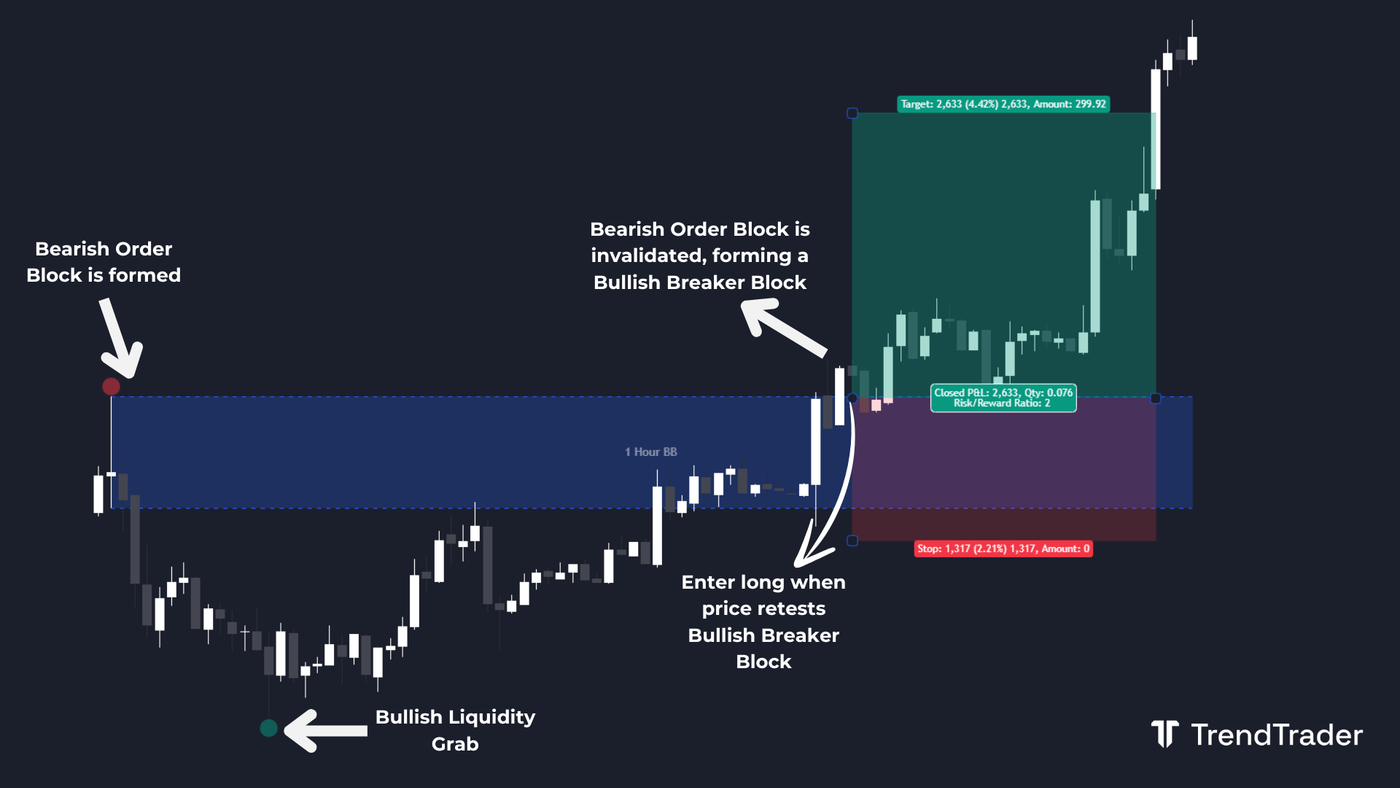
In this long trade setup, a bearish order block forms first. Price continues lower, then a bullish liquidity grab sweeps stops beneath a prior swing low. That sweep provides confluence for a potential long.
A few candles later, a bullish candle closes above the bearish order block, invalidating it and converting it to a bullish breaker block. When price returns to retest the zone, place a stop loss just below it and size for a 1:2 risk-to-reward target.
Short Trade Example
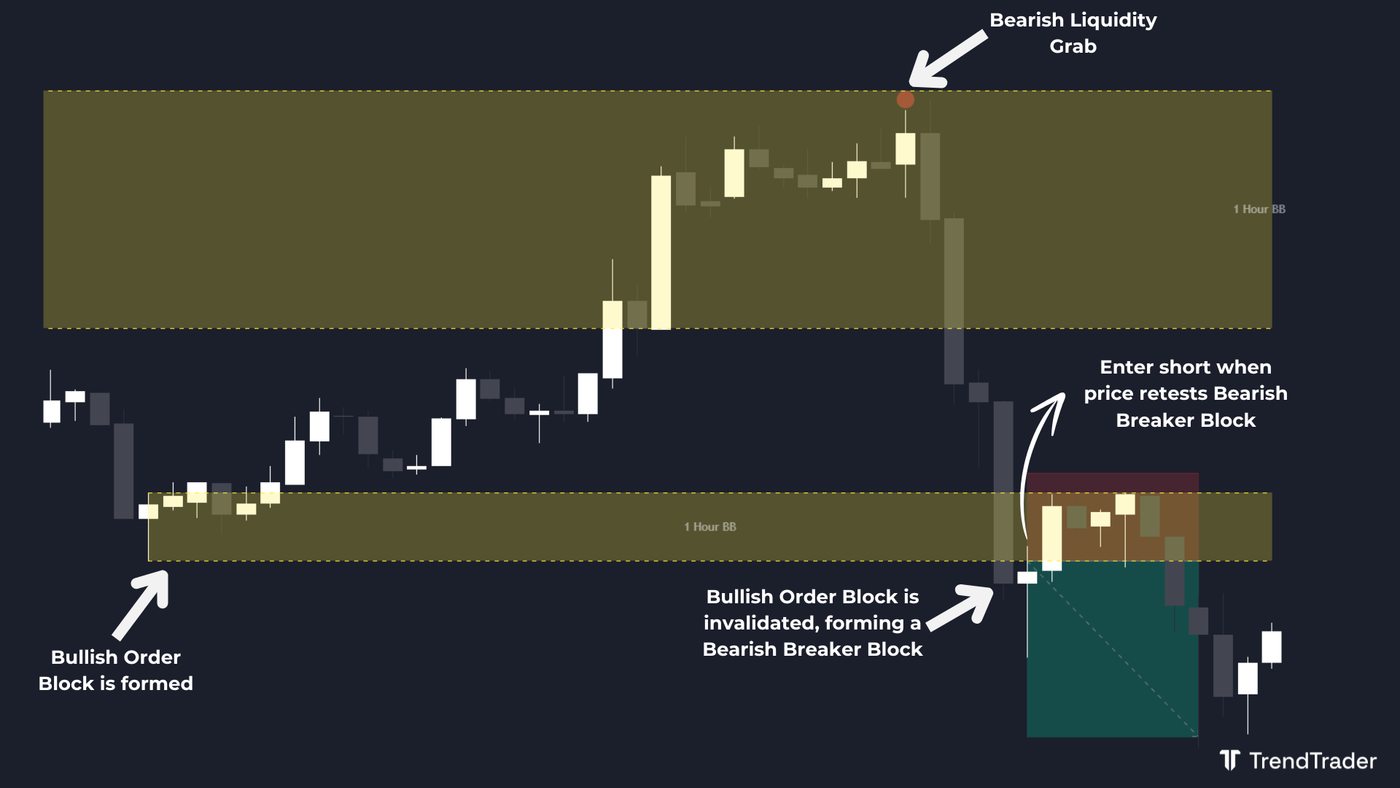
In this short trade setup, a bullish order block forms first. Price continues higher, then a bearish liquidity grab sweeps stops above a prior swing high, providing confluence for a short.
A few candles later, a bearish candle closes below the bullish order block, invalidating it and converting it to a bearish breaker block. When price retests the zone, place a stop loss just above it and target a 1:2 risk-to-reward.
What Is the Difference Between an Order Block and a Breaker Block?
Order blocks are active supply or demand zones formed at swing points before a strong directional move. They remain valid until price returns and closes through them.
Breaker blocks are what order blocks become after invalidation. Where an order block expects price to respect and reverse, a breaker block expects price to use the former zone as new support or resistance on a retest.
The short version: an order block is a live zone. A breaker block is a flipped zone.
What Is the Best Timeframe To Trade Breaker Blocks On?
Breaker blocks work across all timeframes. Scalpers find them on the one-minute and five-minute charts. Day traders use the 15-minute and hourly. Swing traders look at the four-hour and daily.
The general rule in technical analysis holds here: higher timeframes produce more reliable zones. A breaker block on the daily chart carries more weight than one on the five-minute, because more participants are watching and reacting to it.
The most effective approach is top-down analysis. Identify the breaker block on a higher timeframe, then drop to a lower timeframe to time your entry with precision.
How Do You Identify Strong Breaker Blocks?
Not every breaker block is worth trading. The strongest ones share a few characteristics.
Higher timeframe origin: a zone on the daily or four-hour chart is more significant than one on a lower timeframe. Clean invalidation: a decisive candle close through the order block (not just a wick tap) suggests stronger momentum behind the move. Confluence nearby: a liquidity grab, fair value gap, or clear market structure shift at the same level strengthens the case. First retest: zones lose their edge after repeated visits. A fresh breaker block being tested for the first time carries higher probability than one that has been touched multiple times.
Trading breaker blocks with confluence across multiple timeframes is more consistent than trading them in isolation. No zone guarantees a reversal, and your stop loss should always reflect the actual risk you are willing to take on a single trade.
This article is for educational purposes only and does not constitute financial advice. Trading involves significant risk of loss. Do your own research and consult a licensed financial advisor before making any trading decisions.
Browse more trading concept guides on the TrendTrader blog.
