

Change In State of Delivery (CISD) Explained: How to Identify and Trade It
A Change In State of Delivery (CISD) is an early momentum shift signal used in SMC and ICT trading. Learn how to identify bullish and bearish CISDs and trade them with fair value gaps.

A Change In State of Delivery (CISD) is an early reversal signal in SMC and ICT trading. It marks the point where price's momentum shifts suddenly from bearish to bullish, or from bullish to bearish, after sweeping a key liquidity level. A bullish CISD signals that bearish momentum is giving way to buyers. A bearish CISD signals that bullish momentum is giving way to sellers.
A CISD forms before a change of character (CHoCH) and before a break of structure (BOS). That makes it one of the earliest signs of a reversal available on the chart, which also means it carries more risk than waiting for structural confirmation.
What Is a Change In State of Delivery (CISD)?
A CISD is a reversal pattern where price sweeps liquidity at a key level and then closes sharply back through a specific reference price, signaling that momentum has flipped. The reference price is the opening price of the candle (or series of candles) that initiated the most recent trend leg.
The concept focuses on the delivery of price: whether the market is currently delivering price in a bullish or bearish manner. A change in that delivery state is the signal. It is faster and earlier than a CHoCH because it does not require price to break a swing high or swing low, only to close back through the most recent trend's opening price after a liquidity sweep
How to Identify a Change In State of Delivery (CISD)
The identification process is the same for both bullish and bearish CISDs: confirm the trend, find the key level, wait for the liquidity sweep, and then watch for price to close back through the reference open price.
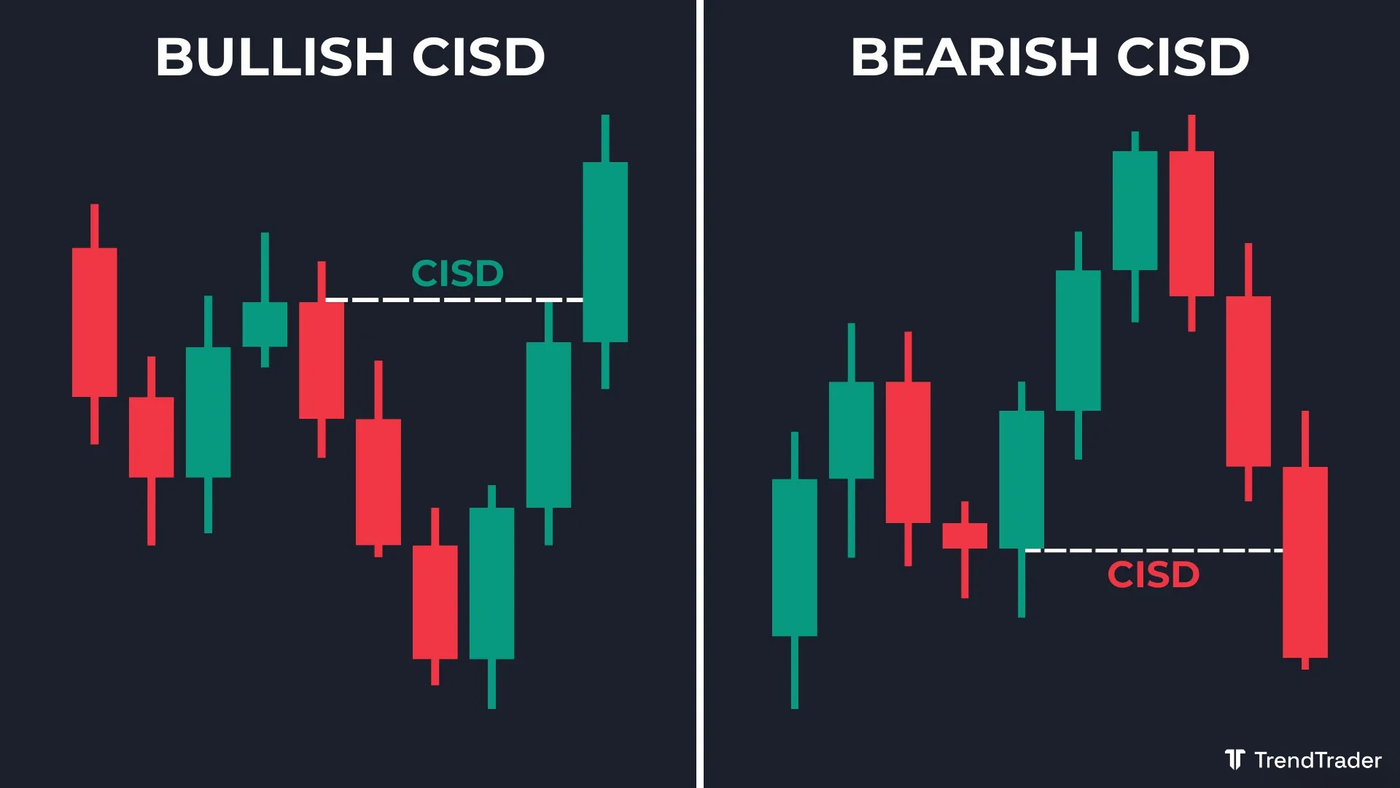
How to Identify a Bullish CISD
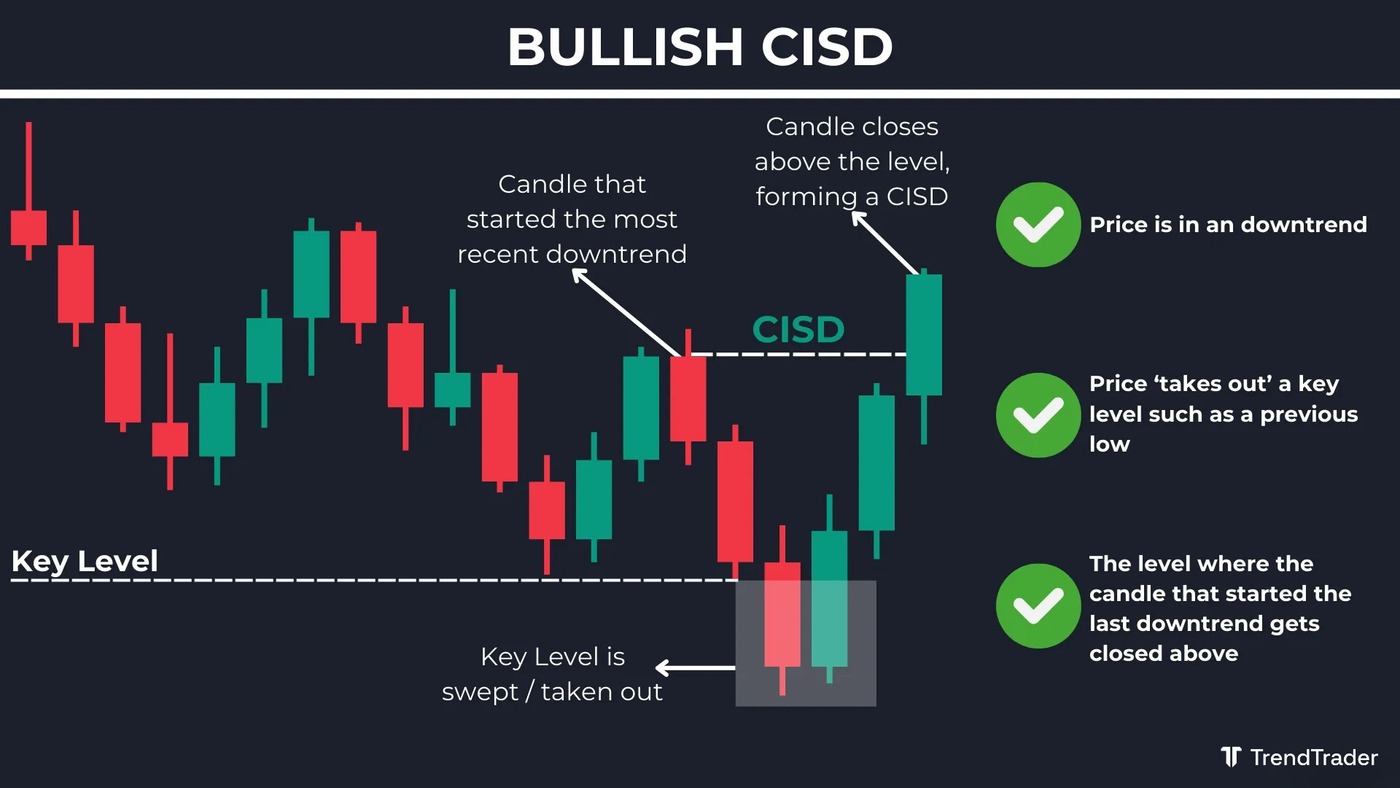
Start by confirming the market is in a downtrend. You want to see a clear bearish sequence: a high (H), followed by a lower high (LH), a low (L), and a lower low (LL). This confirms price is being delivered in a bearish manner.
Next, mark your key levels: prior session lows, daily lows, weekly lows, or swing lows where sellside liquidity is resting. Wait for price to sweep one of these levels by trading below it and quickly reversing back above.
Finally, identify the opening price of the candle (or the first candle) that started the most recent bearish leg or series of bearish candles. A bullish CISD is confirmed when price closes above this opening price after the liquidity sweep. That close signals the momentum has shifted: the bearish delivery has ended and bullish delivery has begun.
How to Identify a Bearish CISD
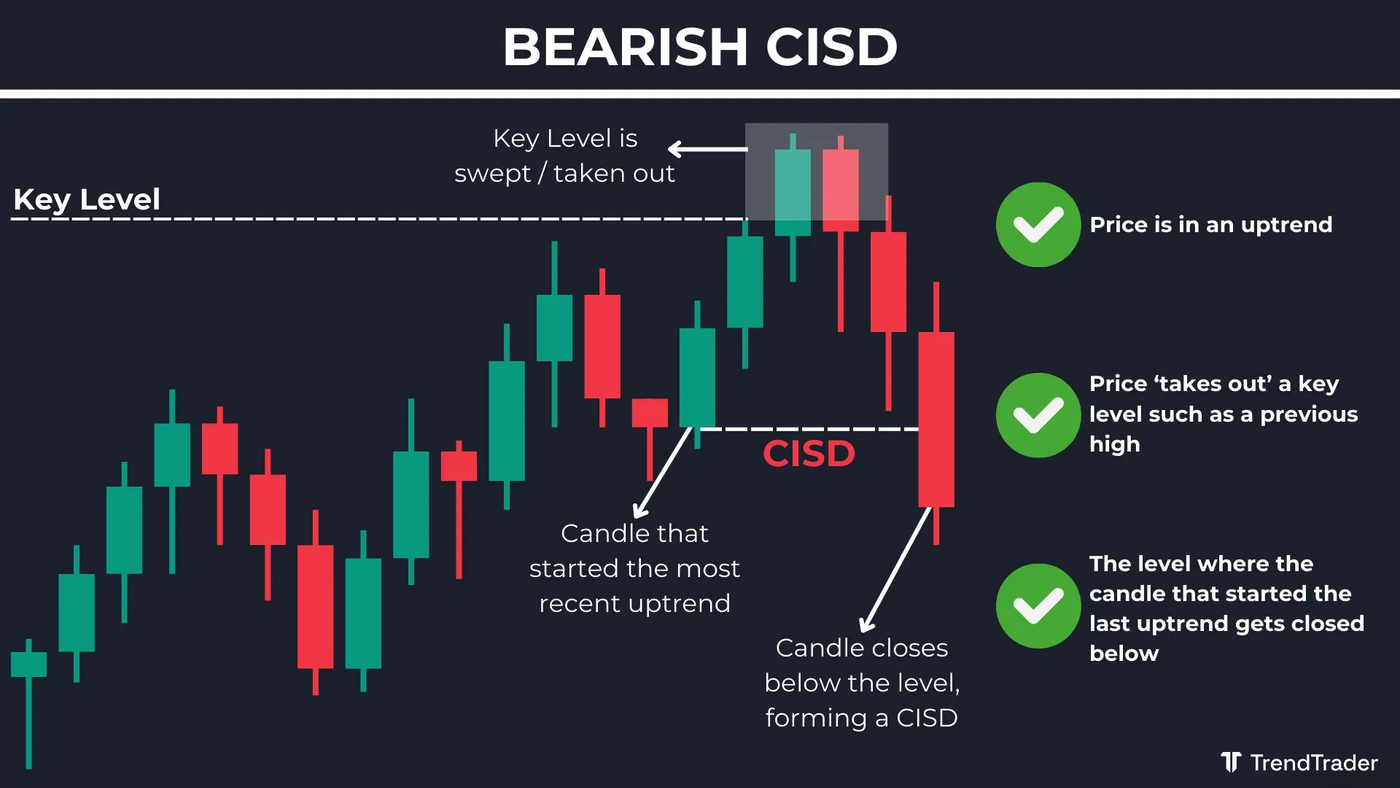
Start by confirming the market is in an uptrend. You want to see a clear bullish sequence: a low (L), a high (H), a higher low (HL), and a higher high (HH). This confirms price is being delivered in a bullish manner.
Next, mark your key levels: prior session highs, daily highs, weekly highs, or swing highs where buyside liquidity is resting. Wait for price to sweep one of these levels by trading above it and quickly reversing back below.
Finally, identify the opening price of the candle (or the first candle) that started the most recent bullish leg or series of bullish candles. A bearish CISD is confirmed when price closes below this opening price after the liquidity sweep. That close signals the momentum has shifted: the bullish delivery has ended and bearish delivery has begun.
How to Trade With Change In State of Delivery (CISD)
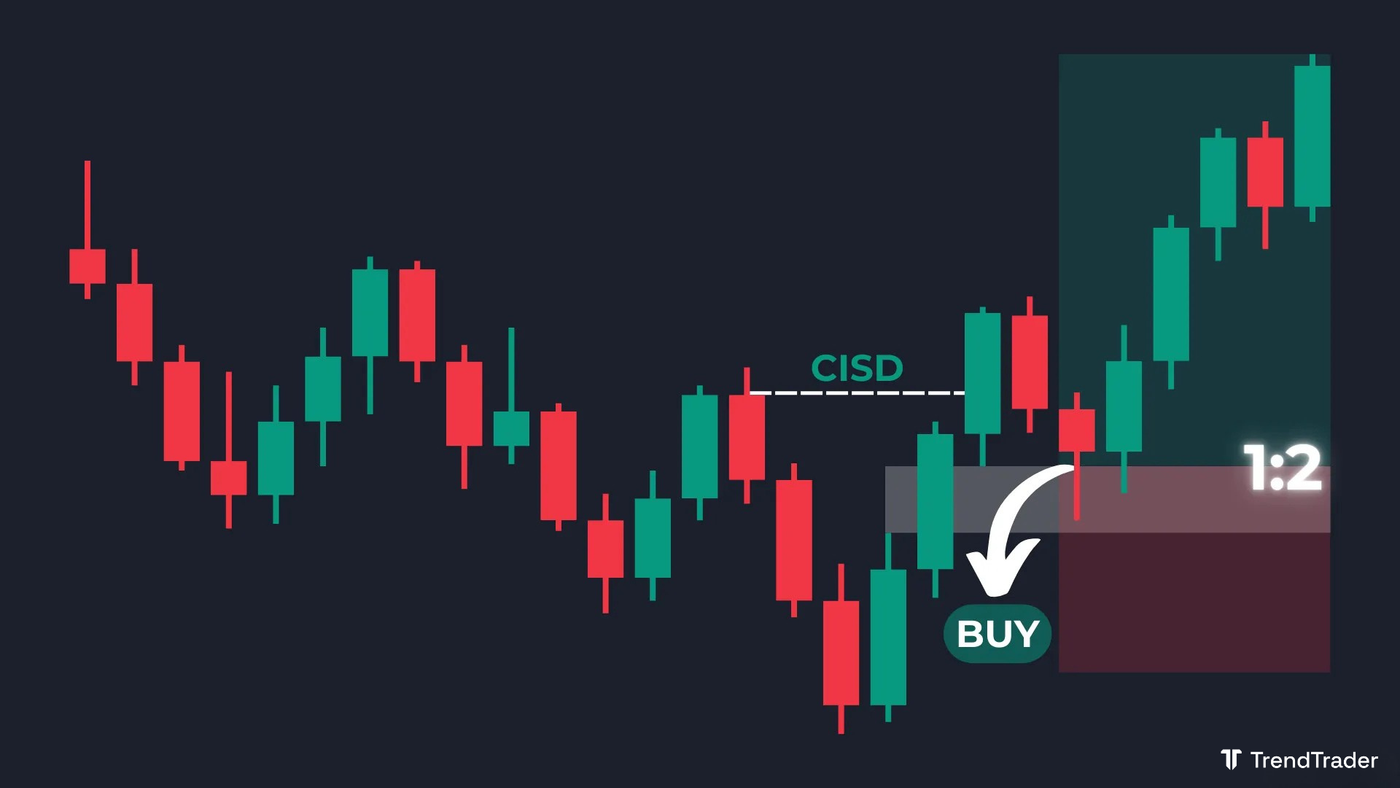
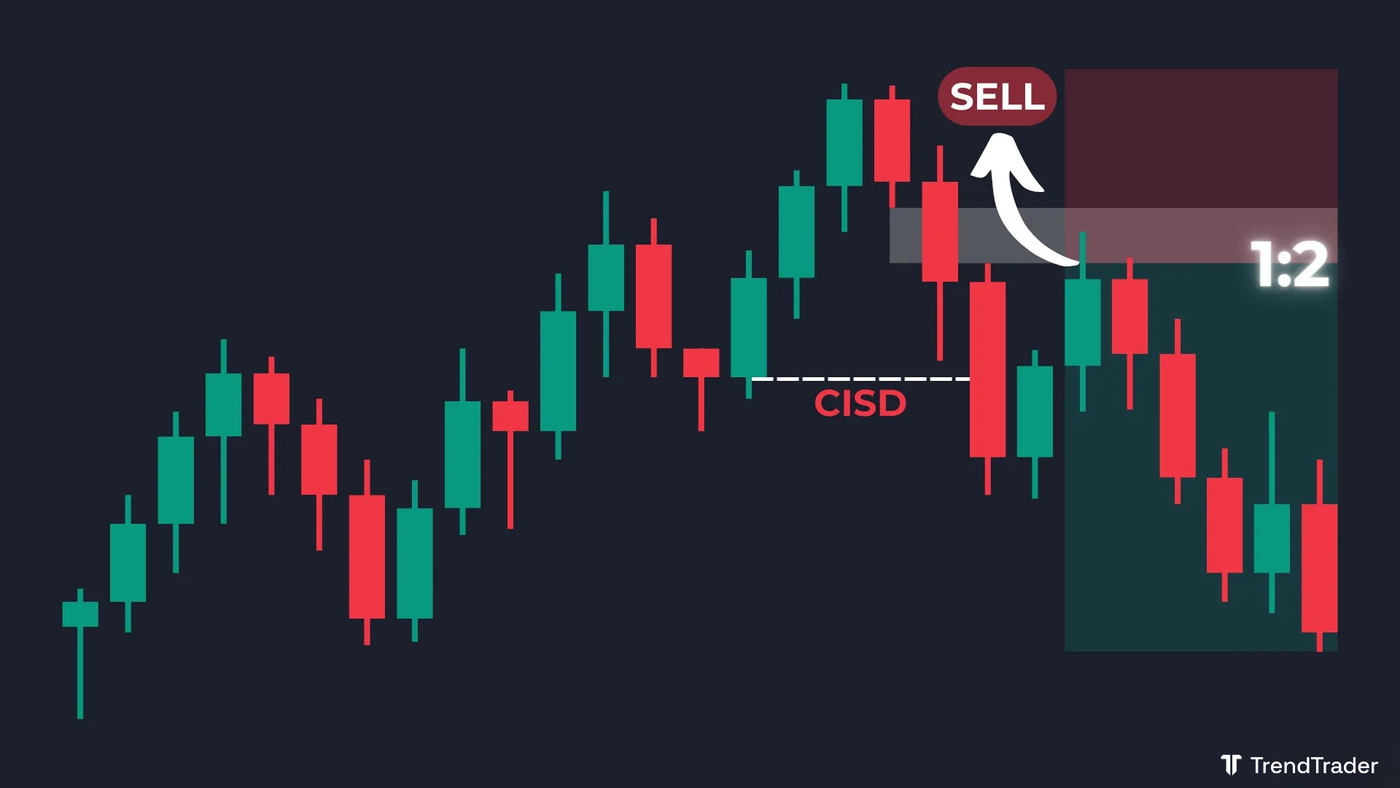
A CISD gives you a directional bias, not a direct entry point. Once a bullish CISD forms, look for long trade setups. Once a bearish CISD forms, look for short trade setups. The entry itself should come from a specific price zone that forms after the CISD, most commonly a fair value gap (FVG) created by the momentum candles that confirmed the shift.
CISD Long Trade Example
A bullish CISD forms: price sweeps a sellside liquidity level, then a candle closes above the opening price of the prior bearish leg. The momentum candles that created the CISD leave a bullish fair value gap (FVG) on the chart. Wait for price to retrace into the FVG, enter long, set your stop loss below the FVG, and target a 1:2 or greater risk-to-reward. The CISD told you the direction. The FVG gave you the entry.
CISD Short Trade Example
A bearish CISD forms: price sweeps a buyside liquidity level, then a candle closes below the opening price of the prior bullish leg. The momentum candles that created the CISD leave a bearish fair value gap (FVG) on the chart. Wait for price to retrace into the FVG, enter short, set your stop loss above the FVG, and target a 1:2 or greater risk-to-reward. The CISD told you the direction. The FVG gave you the entry.
CISD vs. CHoCH
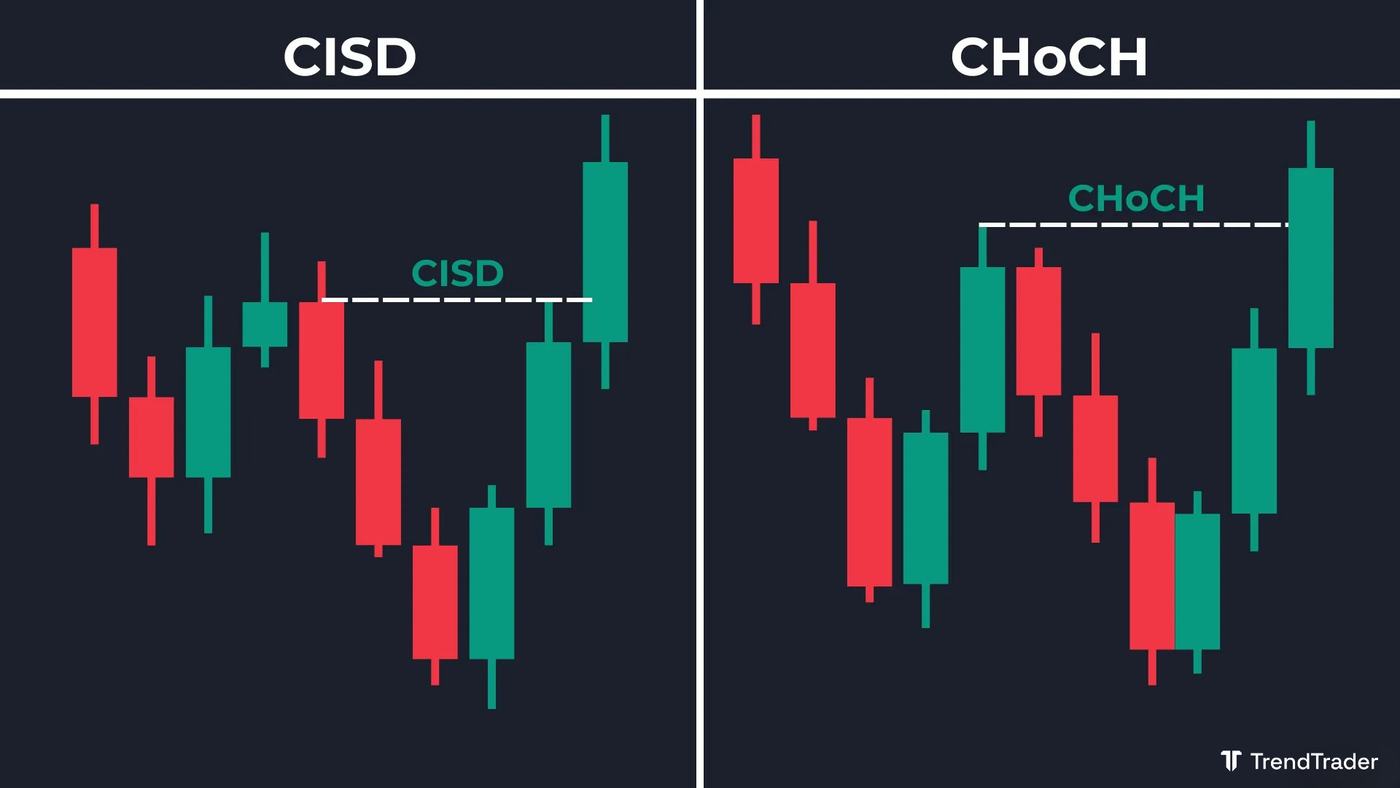
A CISD and a change of character (CHoCH) both signal a potential trend reversal, but they form at different points in the sequence and use different reference levels.
A CISD forms early: it uses the opening price of the most recent trend leg as its reference point and requires only a close back through that level after a liquidity sweep. It does not require price to break a swing high or swing low. It is faster to signal but carries more risk because the reversal is not yet structurally confirmed.
A CHoCH forms later: it requires price to break the last significant swing high (in a downtrend) or swing low (in an uptrend). This is a structural confirmation that the trend has reversed. A CISD typically forms before a CHoCH. If you see a CISD followed by a CHoCH, the two together are a stronger reversal signal than either alone.
The practical takeaway: use CISD for early entries with a tighter stop. Wait for CHoCH confirmation if you want more structural backing before entering.
What Are the Key Levels to Watch When Identifying a CISD?
The most reliable CISDs form at levels where significant liquidity has accumulated: prior session highs and lows, daily highs and lows, weekly highs and lows, and monthly highs and lows. These are the levels where the largest clusters of stop orders are resting, making them the most likely targets for a liquidity sweep before a reversal.
Swing highs and swing lows, as well as equal high and equal low formations, are also valid CISD zones. The key is that the level must be significant enough to represent a genuine pool of resting orders, not an arbitrary minor pullback high or low.
What Is the Best Timeframe to Trade a CISD?
CISDs form on all timeframes. For context and bias, analyze higher timeframes first: a CISD on the four-hour or daily chart is a more significant momentum shift than one on the five-minute chart. Use the higher timeframe CISD to establish your directional bias, then drop to a lower timeframe to time the entry at the resulting FVG or order block.
If you are intraday trading, confirm that the higher timeframe trend aligns with your CISD before entering. A bullish CISD on the 15-minute chart that runs against a strong bearish daily trend carries significantly more risk than one aligned with it.
FAQ
What does CISD stand for?
CISD stands for Change In State of Delivery. It refers to a shift in the manner in which price is being delivered: from bearish delivery to bullish delivery, or vice versa. The term comes from ICT (Inner Circle Trader) trading concepts.
How is CISD different from CHoCH?
A CISD uses the opening price of the most recent trend leg as its reference and signals a momentum shift before structural confirmation. A CHoCH requires a break of the last swing high or low, providing structural confirmation of a trend reversal. CISD is earlier and faster. CHoCH is later and more confirmed. In a full reversal sequence, a CISD typically forms first, followed by a CHoCH.
Can CISD be used on any market?
Yes. CISD is a price action concept that applies to any liquid market: forex, futures, indices, equities, and crypto. The key requirement is that the market has clear liquidity levels at prior session or swing highs and lows, and that price action is clean enough to identify the trend leg's opening price.
This article is for educational purposes only and does not constitute financial advice. Trading involves significant risk of loss. Do your own research and consult a licensed financial advisor before making any trading decisions.
Browse more trading concept guides on the TrendTrader blog.
