

Equal Highs (EQHs) Explained: Definition, Strategy & Common Mistakes
An equal high (EQH) is a bearish market structure signal formed when price tests the same swing high twice and rejects. Learn what EQHs are, how to identify them, and how to trade them.

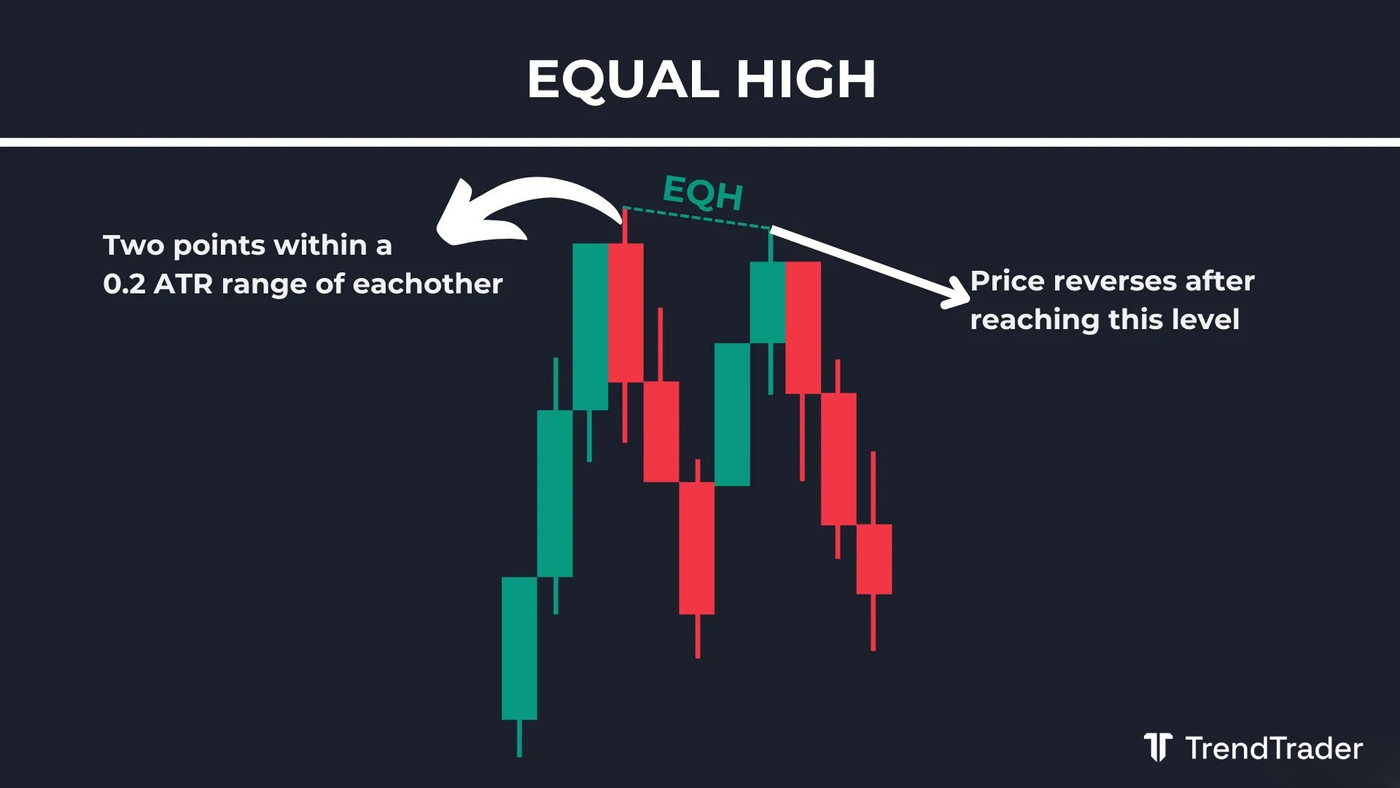
An equal high (EQH) forms when price reaches a previous swing high and rejects at approximately the same level, creating two highs at roughly the same price. In SMC and ICT-based trading, this is treated as a bearish signal. The equal high marks a resistance level where buyers have twice failed to push higher, suggesting sellers are in control at that price.
How to Identify an Equal High (EQH)
To find an equal high, identify a swing high on your chart: a peak where price reversed after moving up. Then watch for price to rally again and test the same level. When price reaches approximately that same high and rejects rather than breaking through, an equal high has formed. The candle retesting the level must not close above the original swing high.
The logic is simple: price tried to break through a level once and failed. The second attempt at the same level and another rejection confirms that supply is consistently stepping in at that price. Two failures at the same high is stronger evidence of resistance than one.
Trading Using an Equal High (EQH)
Equal highs are not standalone entry signals. They confirm a bearish bias, telling you the market is likely to reverse or continue lower from that level. Once an EQH forms, look for short entries on pullbacks rather than entering immediately at the level.
A trader who sees an EQH form can shift to a bearish outlook and begin looking for short setups. The EQH gives you the directional bias. You still need a specific entry point with a defined stop and risk-to-reward.
Common Strategy Using Equal Highs (EQHs)
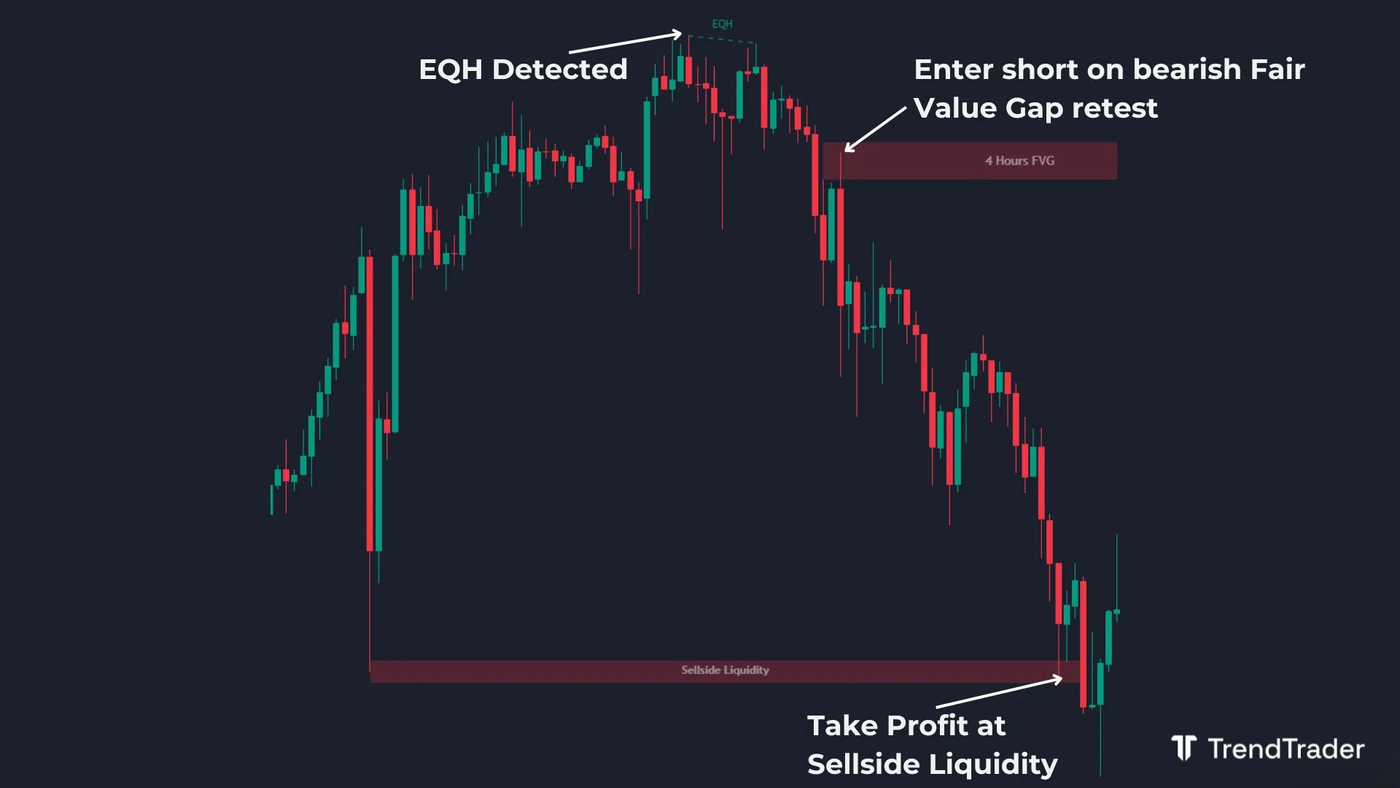
One effective approach pairs equal highs with a bearish fair value gap (FVG). After an EQH forms and confirms bearish bias, wait for price to pull back into a bearish FVG. That retest of the FVG is your entry zone. Set your stop above the FVG and target key levels below: a bullish order block, a support level, or a buy-side liquidity zone.
The combination works because the EQH confirms the directional bias and the FVG gives you a precise, defined-risk entry. Two independent signals pointing the same way is more reliable than either one alone.
What Is the Best Timeframe for Using Equal Highs?
Equal highs work across all timeframes. Day traders commonly look for them on the 1-minute to 15-minute charts. Swing traders use the hourly, four-hour, and daily. As with most price action concepts, higher timeframe equal highs carry more weight because more participants are reacting to those levels.
Shorter timeframe equal highs produce more signals but with more noise. An EQH on the daily or four-hour chart at a well-known resistance level is more meaningful than one on the five-minute chart. Top-down analysis applies: identify the EQH on a higher timeframe, then use a lower timeframe to time your entry.
What Is a Common Mistake When Trading Equal Highs?
The most common mistake is treating an equal high as an entry signal on its own. An EQH alone tells you resistance exists at a level. It does not tell you when to enter, where to put your stop, or how far price will travel. Entering short simply because an EQH formed, without additional confluence, leads to low-probability trades.
Build equal highs into a system. Use them to establish a bearish bias, then look for a fair value gap, order block, or liquidity grab at a nearby level to time your entry. The EQH frames the trade. Confluence executes it.
How Accurate Are Equal Highs When Predicting Price Movements?
Equal highs are reliable indicators of resistance and potential reversals, but no single pattern guarantees a specific outcome. Their usefulness increases when combined with other bearish confluence: a bearish fair value gap or order block at the same level, a broader downtrend on a higher timeframe, or a liquidity grab just above the equal high before the rejection.
An equal high that forms at a major resistance level, on a higher timeframe, with additional confluence, is more significant than one that forms in isolation on a lower timeframe. Context always matters more than the pattern alone.
This article is for educational purposes only and does not constitute financial advice. Trading involves significant risk of loss. Do your own research and consult a licensed financial advisor before making any trading decisions.
Browse more trading concept guides on the TrendTrader blog.
