

Liquidity Grabs Explained: Definition, Types & Trading Strategy
A liquidity grab is a sharp price spike that sweeps a key liquidity level before reversing. Learn what bullish and bearish liquidity grabs are and how to trade them.

A liquidity grab is a price movement that sweeps through a key liquidity level, triggering a large cluster of stop orders, before reversing sharply in the opposite direction. Bullish liquidity grabs sweep sellside liquidity and signal potential long entries. Bearish liquidity grabs sweep buyside liquidity and signal potential short entries.
To fully understand liquidity grabs, you need a clear picture of how liquidity works: where buy and sell stops accumulate on a chart and why the market targets those levels.
What Are Liquidity Grabs?
A liquidity grab marks an area in the market where a large number of buy or sell orders were triggered in rapid succession. These events typically occur at key levels: the highs and lows of prior sessions, swing highs, swing lows, and equal high or equal low formations.
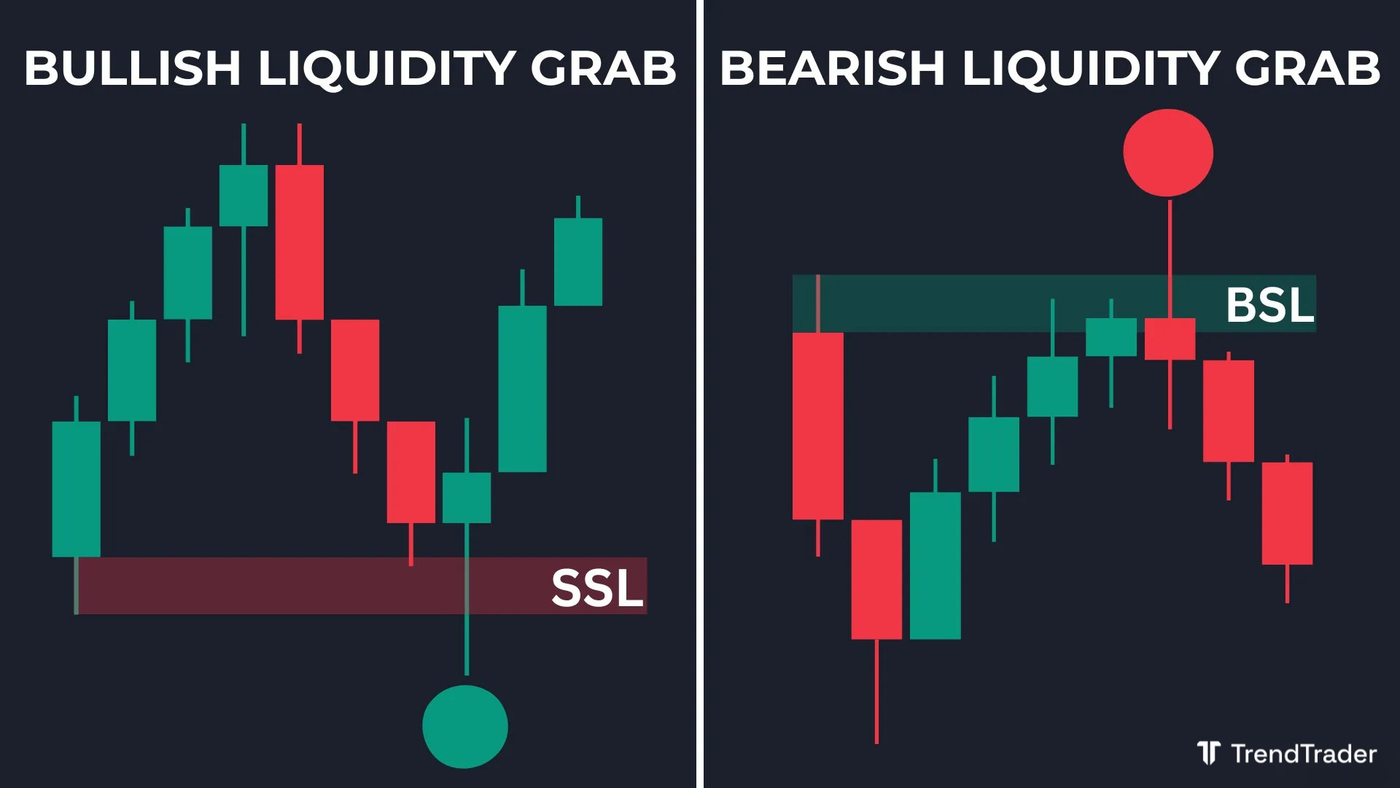
A bullish liquidity grab indicates that a large pool of sell stops (sellside liquidity) was swept and buyers absorbed the resulting orders, likely pushing price higher. A bearish liquidity grab indicates that a large pool of buy stops (buyside liquidity) was swept and sellers absorbed the resulting orders, likely pushing price lower.
How to Spot a Liquidity Grab
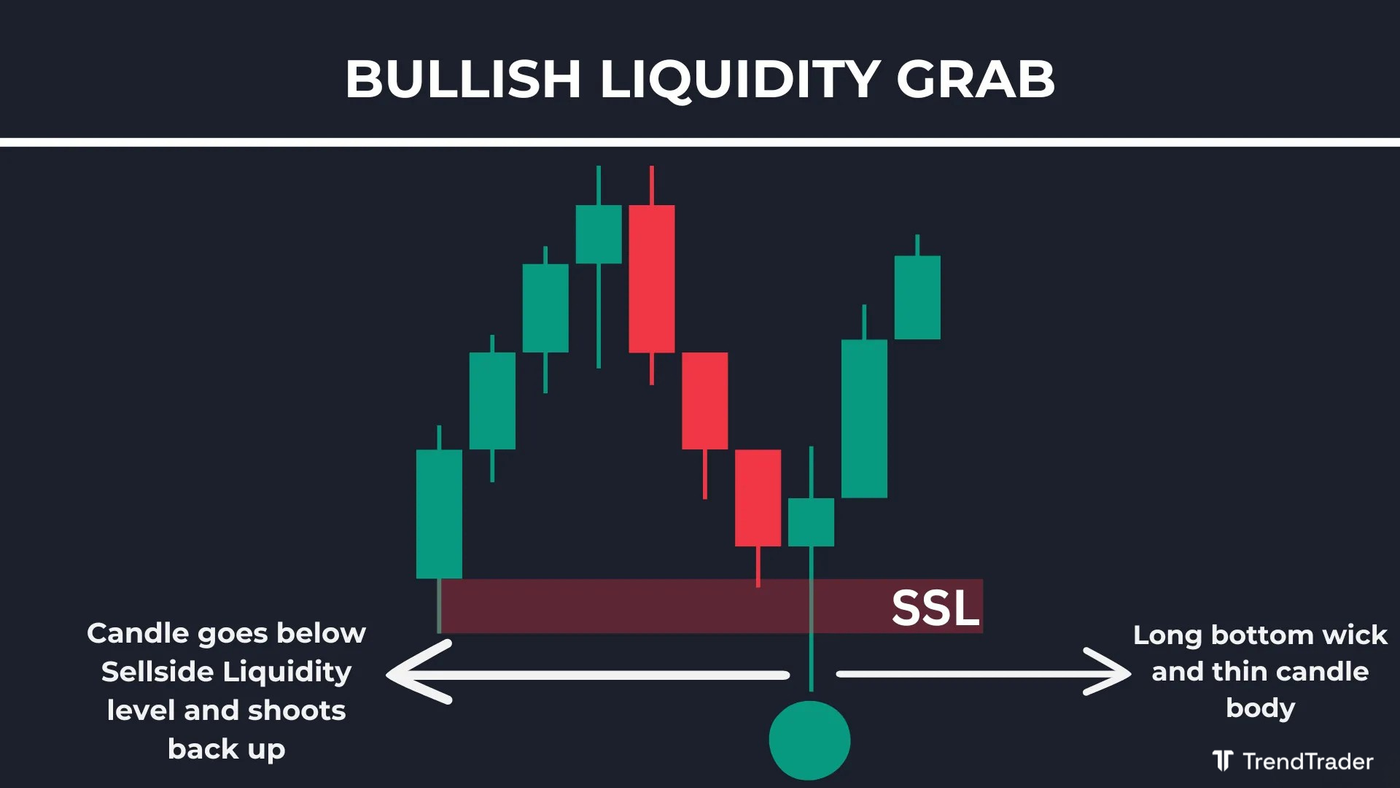
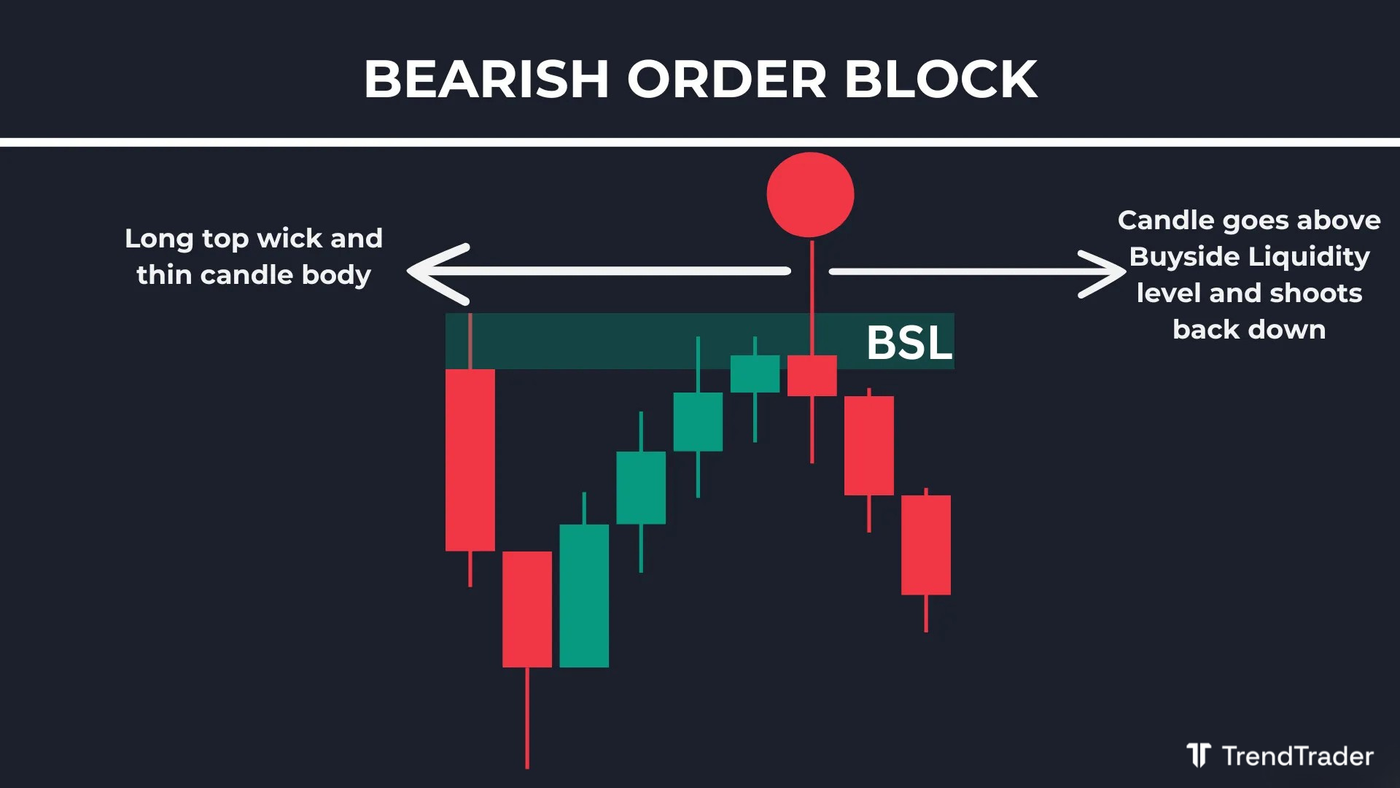
The pattern is distinctive and consistent. Price approaches a key level, then a single candle spikes through it and closes back on the other side. The result is a candle with a large wick and a small body. The wick represents the sweep. The close back through the level confirms that the grab has occurred and the opposing side has stepped in.
This candle type is similar to the Dragonfly Doji (bullish grab, long bottom wick) or the Gravestone Doji (bearish grab, long top wick). The long wick is the tell: it shows that price moved aggressively to one side, triggered the resting orders there, and then reversed.
How To Find a Bullish Liquidity Grab
Watch your sellside liquidity (SSL) levels: swing lows, prior session lows, and equal low formations. When price drops into one of these levels and a candle sends a long wick below it before closing back above, that is a bullish liquidity grab. The long bottom wick shows buyers stepping in aggressively after the stop sweep. Look for long trade opportunities once the candle closes.
How To Find a Bearish Liquidity Grab
Watch your buyside liquidity (BSL) levels: swing highs, prior session highs, and equal high formations. When price rises into one of these levels and a candle sends a long wick above it before closing back below, that is a bearish liquidity grab. The long top wick shows sellers stepping in aggressively after the stop sweep. Look for short trade opportunities once the candle closes.
How to Trade Liquidity Grabs
A liquidity grab establishes your directional bias. A bullish grab means you look for longs only. A bearish grab means you look for shorts only. The grab itself is rarely the entry: it is the signal that sets up what comes next.
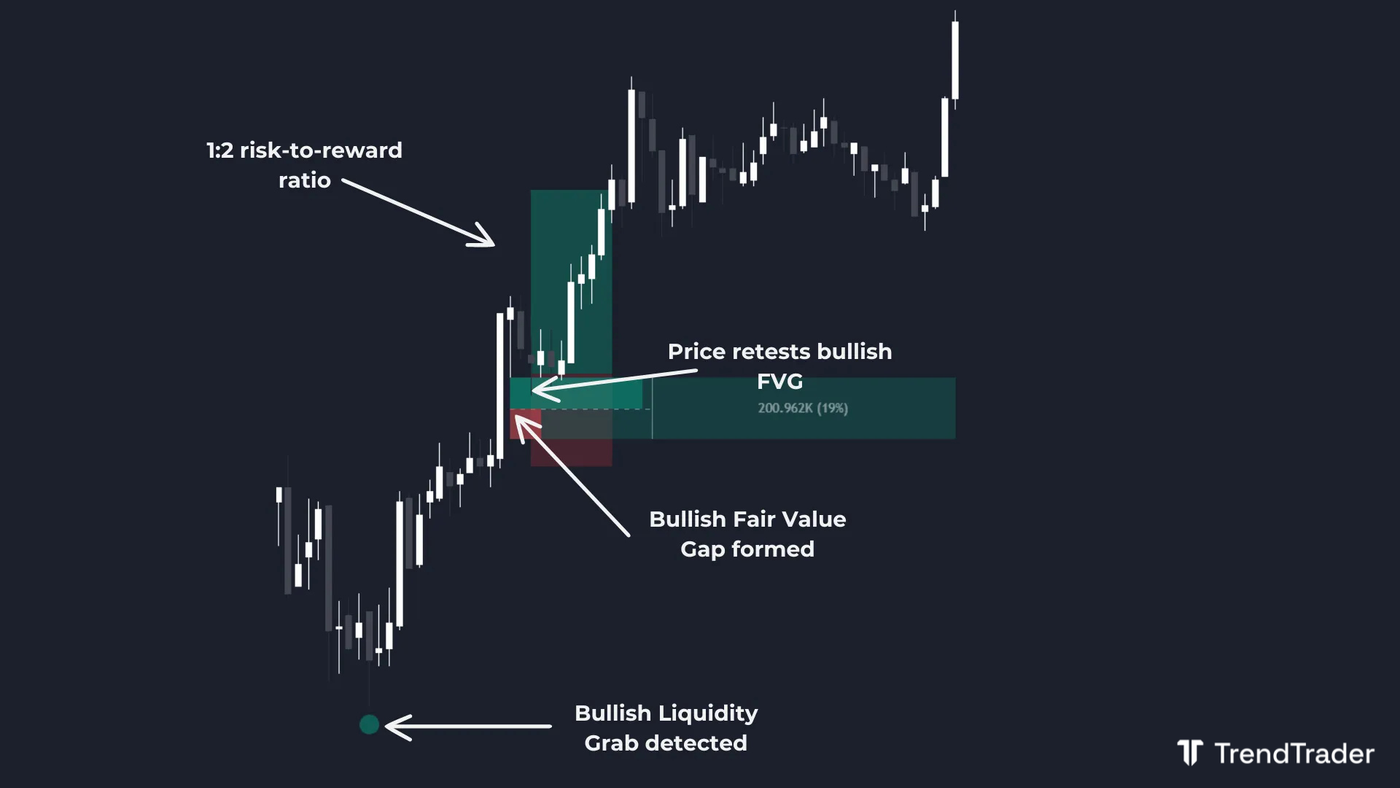
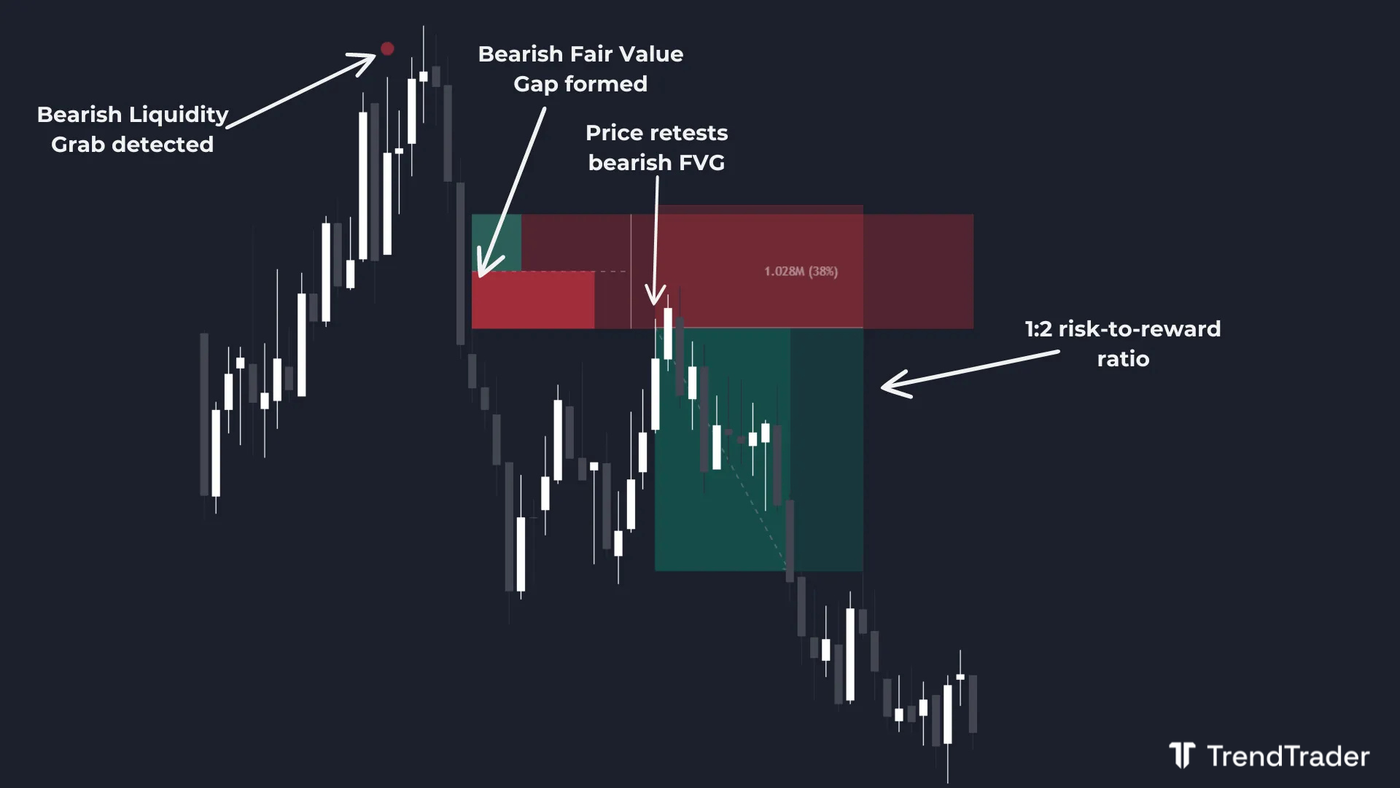
The most effective approach is to combine liquidity grabs with a fair value gap (FVG). After the grab, price typically moves in the new direction and leaves behind an imbalance. When price retests that FVG, that is your entry.
Long Trade Example
A bullish liquidity grab sweeps a sellside liquidity level, confirmed by a candle with a long bottom wick closing back above the level. Price then shoots up, leaving a bullish FVG. When price retraces into the FVG, enter long with a stop loss below the FVG and target a 1:2 risk-to-reward. The grab gave you the bias. The FVG gave you the entry.
Short Trade Example
A bearish liquidity grab sweeps a buyside liquidity level, confirmed by a candle with a long top wick closing back below the level. Price then drops sharply, leaving a bearish FVG. When price retraces up into the FVG, enter short with a stop loss above the FVG and target a 1:2 risk-to-reward. The grab gave you the bias. The FVG gave you the entry.
What Is the Difference Between a Liquidity Grab and a Liquidity Sweep?
A liquidity grab happens fast: a single candle spikes through a key level and closes back on the other side. The entire event happens within one candle. The wick tells the story.
A liquidity sweep is a slower version of the same concept. Price moves through a liquidity level and returns, but it can develop over several candles rather than a single wick. Both result in the same outcome: the level is cleared and price reverses. The grab is sharper and easier to identify in real time.
What Do Liquidity Grabs Indicate?
A liquidity grab indicates a potential shift in market direction. When price sweeps a key level and reverses, a large number of traders were stopped out at that point. The buyers or sellers who absorbed those stops now have momentum, and the market tends to move in their direction.
Liquidity grabs are also useful for understanding market context. They reveal where stop clusters were sitting, which tells you how the market was positioned before the move. That context helps you read subsequent price action more clearly, including order blocks and breaker blocks that form off the back of the grab.
What Is the Best Timeframe to Trade Liquidity Grabs?
Liquidity grabs are most useful on higher timeframes for establishing a directional bias. Spot them on the 30-minute, hourly, or four-hour chart to understand where the market is positioned, then use lower timeframes to execute entries at the resulting fair value gaps or order blocks.
They also work on shorter timeframes for scalping strategies. A liquidity grab on the five-minute or 15-minute chart, followed by a fair value gap retest, is a common short-term setup. Match the timeframe to your trading style and ensure the higher timeframe context supports your direction.
This article is for educational purposes only and does not constitute financial advice. Trading involves significant risk of loss. Do your own research and consult a licensed financial advisor before making any trading decisions.
Browse more trading concept guides on the TrendTrader blog.
