

Market Liquidity Explained: Buyside & Sellside Liquidity in Trading
Liquidity is the foundation of SMC and ICT trading. Learn what buyside liquidity (BSL) and sellside liquidity (SSL) are, how to find them, and why they matter.

Liquidity in trading refers to the pools of resting orders that accumulate at key price levels on a chart. In Smart Money Concepts (SMC) and ICT trading, there are two types: buyside liquidity (BSL) and sellside liquidity (SSL). BSL sits above key highs, where short sellers have placed their stop losses. SSL sits below key lows, where long traders have placed theirs. Understanding where these pools sit is central to understanding how price moves.
What Is Buyside Liquidity (BSL)?
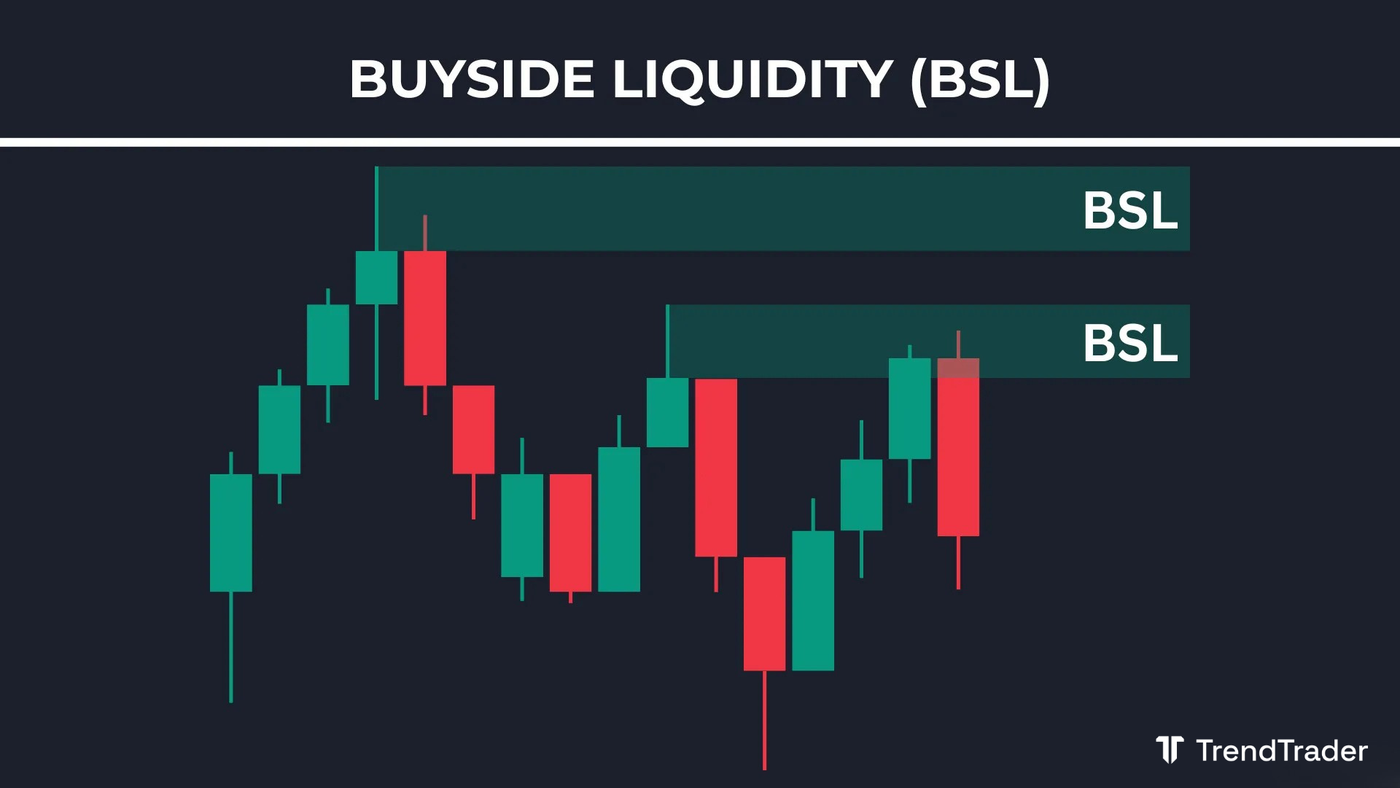
Buyside liquidity refers to price levels where a large concentration of pending buy orders are resting. These buy orders are primarily stop losses placed by traders who are short: when price rises to their stop level, those stop orders trigger as market buys, providing a pool of liquidity for larger participants to sell into.
Buyside liquidity typically accumulates above key highs: swing highs, equal highs, and prior session highs. When price sweeps above these levels before reversing, it is targeting the buyside liquidity sitting there.
What Is Sellside Liquidity (SSL)?
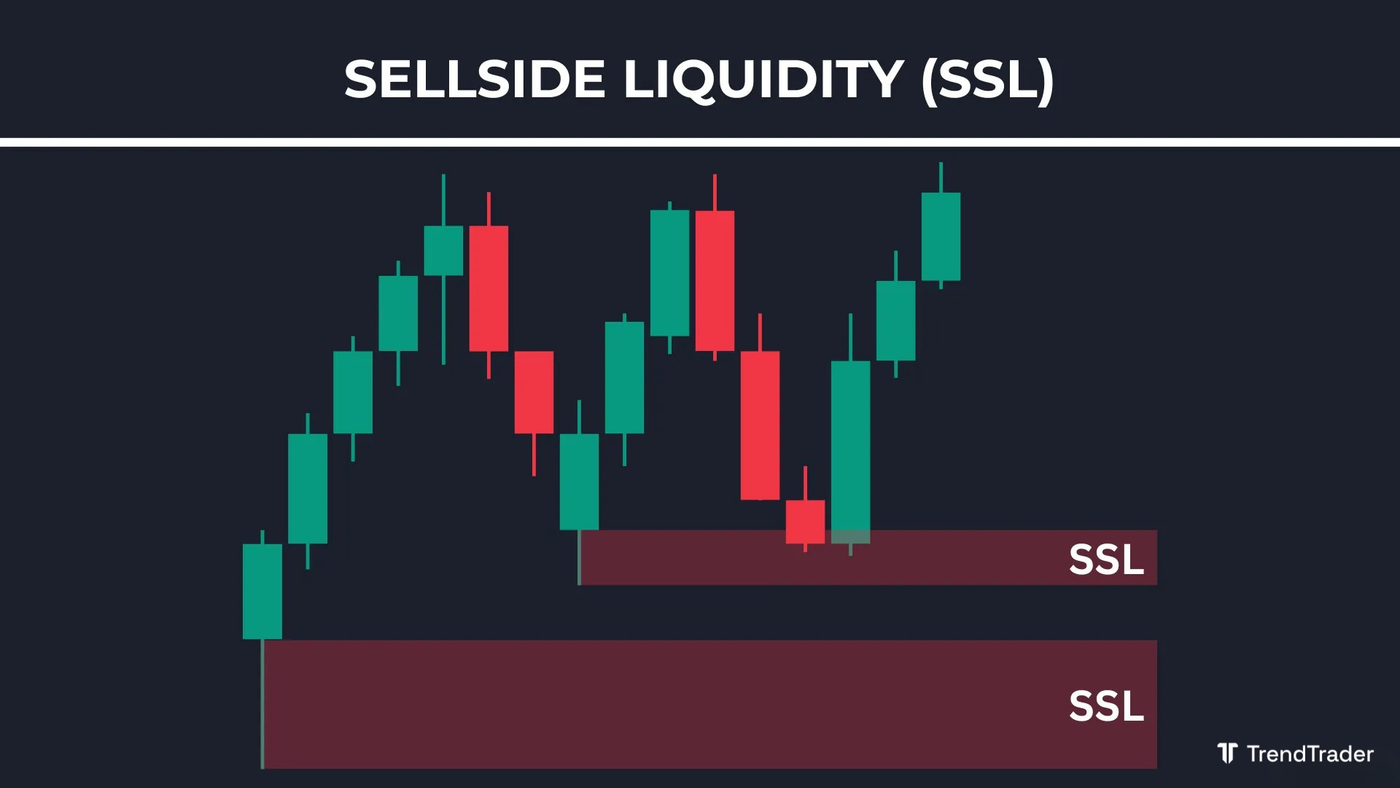
Sellside liquidity refers to price levels where a large concentration of pending sell orders are resting. These sell orders are primarily stop losses placed by traders who are long: when price drops to their stop level, those stop orders trigger as market sells, providing a pool of liquidity for larger participants to buy into.
Sellside liquidity typically accumulates below key lows: swing lows, equal lows, and prior session lows. When price sweeps below these levels before reversing, it is targeting the sellside liquidity sitting there.
How to Identify Liquidity Levels in Trading
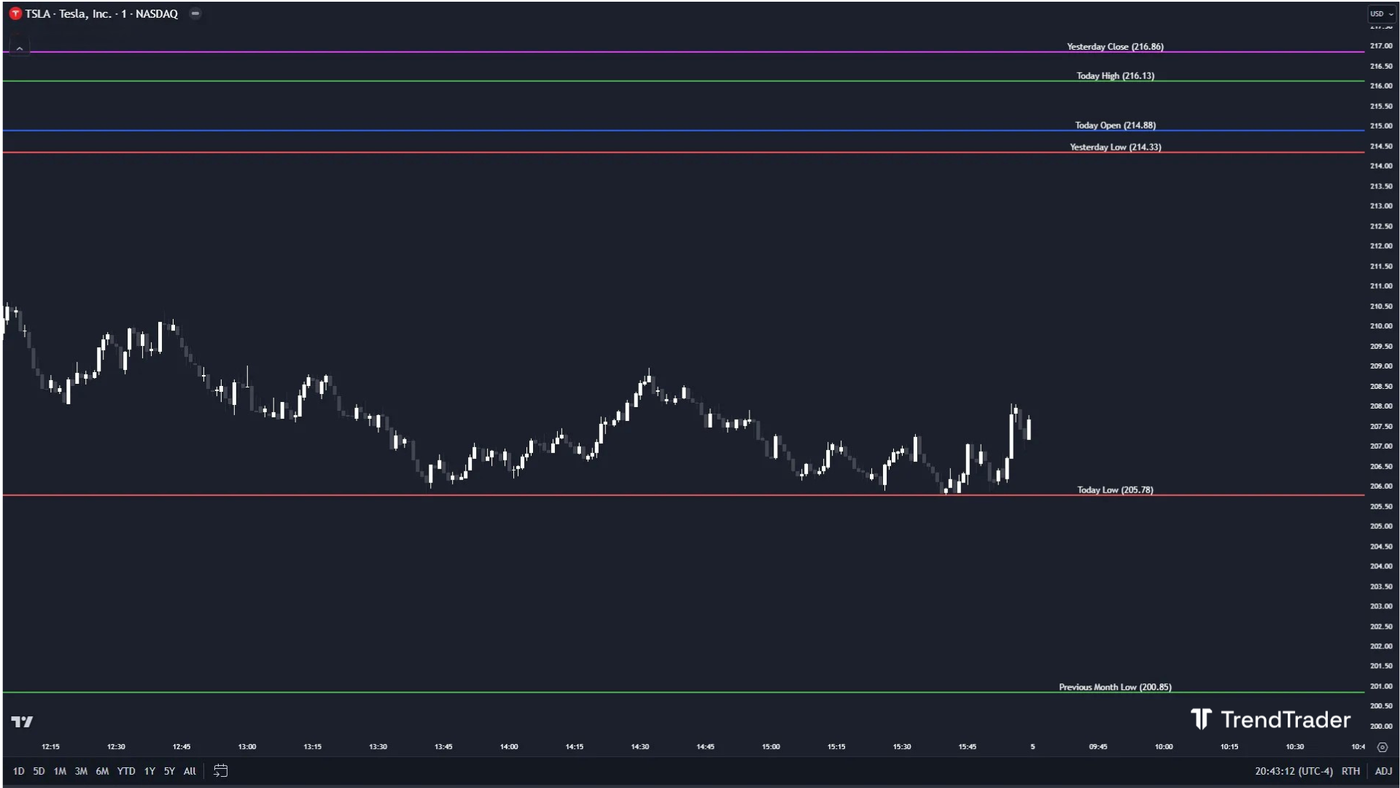
Liquidity levels are found by marking the price points where clusters of stop orders are most likely to rest. The more participants who have stops at a given level, the more significant the liquidity pool.
How to Identify Buyside Liquidity (BSL)
Mark the following levels on your chart to locate buyside liquidity:
Swing highs: a swing high forms when price makes a peak and is followed by a lower high. These are the most common resting points for short sellers' stops.
Previous day high (PDH): the highest price reached in the prior trading session. Traders use PDH as a reference for market strength and potential reversal zones, making it a common stop placement level.
Previous week high (PWH): the highest price reached during the prior week. A critical benchmark for identifying potential resistance and trend continuation or reversal points on a broader scale.
Previous month high (PMH): the peak of price action over the prior month. A significant level that influences market sentiment. If this level is swept and fails to hold, it can signal a meaningful shift in trend direction.
How to Identify Sellside Liquidity (SSL)
Mark the following levels on your chart to locate sellside liquidity:
Swing lows: a swing low forms when price makes a trough and is followed by a higher low. These are the most common resting points for long traders' stops.
Previous day low (PDL): the lowest price reached in the prior trading session. A key reference point for assessing market weakness and potential reversal zones.
Previous week low (PWL): the lowest price level reached during the prior week. A critical benchmark for identifying potential support, trend continuation, or reversal zones on a wider timeframe.
Previous month low (PML): the lowest area of price action over the prior month. A significant level that influences broader market sentiment and reveals the strength of an ongoing trend.
Why Is Liquidity Important in Trading?
Traders who understand liquidity can identify where market makers and institutional participants are likely to drive price before making a significant move. Large participants need liquidity to fill their orders: they drive price into pools of resting stops, trigger those orders, and then reverse in the opposite direction.
This is why price so often spikes above a prior high or below a prior low before reversing sharply. It is not random. It is the market seeking the liquidity needed to fill large positions. Understanding this logic helps you place your own stop losses more intelligently, away from the obvious liquidity pools that price hunts.
Liquidity grabs also pair directly with order blocks and breaker blocks as confluence for trade entries. A sweep of a liquidity level followed by a reversal at a key zone is one of the most commonly traded setups in SMC.
Which Timeframes Should You Look for Liquidity?
Liquidity should be identified across multiple timeframes to get a clear picture of where significant pools are resting. Higher timeframe levels (daily, weekly, monthly) carry more weight because more participants are watching and positioning around them.
If you trade intraday, focus on the timeframes relevant to your style. Scalpers should pay attention to the 30-minute and one-hour levels. Day traders should mark daily and weekly highs and lows as their primary BSL and SSL reference points. Aligning your liquidity analysis with your trading timeframe keeps the picture clean and avoids overcomplicating your charts.
This article is for educational purposes only and does not constitute financial advice. Trading involves significant risk of loss. Do your own research and consult a licensed financial advisor before making any trading decisions.
Browse more trading concept guides on the TrendTrader blog.
