

SMT Divergences Explained: How to Identify and Trade Them
An SMT divergence occurs when two correlated assets fail to confirm each other's highs or lows. Learn what SMT divergences are, how to spot bullish and bearish setups, and how to trade them.

An SMT divergence (Smart Money Technique divergence) occurs when two positively correlated assets fail to confirm the same high or low at the same time. One asset makes a lower low while the other makes a higher low, or one makes a higher high while the other makes a lower high. That divergence between the two charts signals a potential market reversal.
SMT divergences are used as confluence in SMC and ICT trading, not as standalone buy or sell signals. They flag a mispricing between related markets that often precedes a sharp directional move.
What Are SMT Divergences?
Traditional divergence compares an asset's price with an indicator such as RSI or MACD: price makes a new high but the indicator does not, suggesting momentum is weakening. SMT divergences apply the same logic across two separate assets instead of one asset versus an indicator.
If two assets are positively correlated, they should broadly make the same highs and lows. When one makes a lower low and the other makes a higher low at the same time, those two assets are diverging. That divergence can indicate that the lower low was a stop hunt or liquidity sweep rather than a genuine breakdown, and that a reversal is likely.
Market Correlations
To use SMT divergences correctly, you need to understand how assets relate to each other. There are three types of correlation.
Positive Correlation
Positively correlated assets move in the same direction. When one rises, the other tends to rise. This typically occurs because both assets respond to the same economic factors, belong to the same sector, or track the broader market.
Common examples: JPMorgan Chase (JPM) and Bank of America (BAC) tend to move together because both respond to interest rate changes and financial regulation. ExxonMobil (XOM) and Chevron (CVX) move in sync because both are driven by oil prices and energy market trends. In futures, the S&P 500 (ES) and Dow Jones (YM) are closely correlated indices that SMT traders frequently compare.
Negative Correlation
Negatively correlated assets move in opposite directions. When one rises, the other tends to fall. This often occurs between assets that react differently to the same conditions.
Common examples: Gold (XAUUSD) and the US Dollar (DXY) tend to move inversely because a stronger dollar makes gold more expensive for international buyers, suppressing demand. Oil prices and airline stocks often move inversely because higher fuel costs compress airline margins while lower fuel costs boost them.
No Correlation
Assets with no correlation move independently of each other, driven by entirely different factors. These pairs are not useful for SMT divergence analysis.
How to Identify an SMT Divergence
Focus on two positively correlated assets. Bullish SMT divergences form at lows. Bearish SMT divergences form at highs. You are looking for moments where one asset confirms a structural move (a lower low or a higher high) but the other does not.
Bullish SMT Divergence
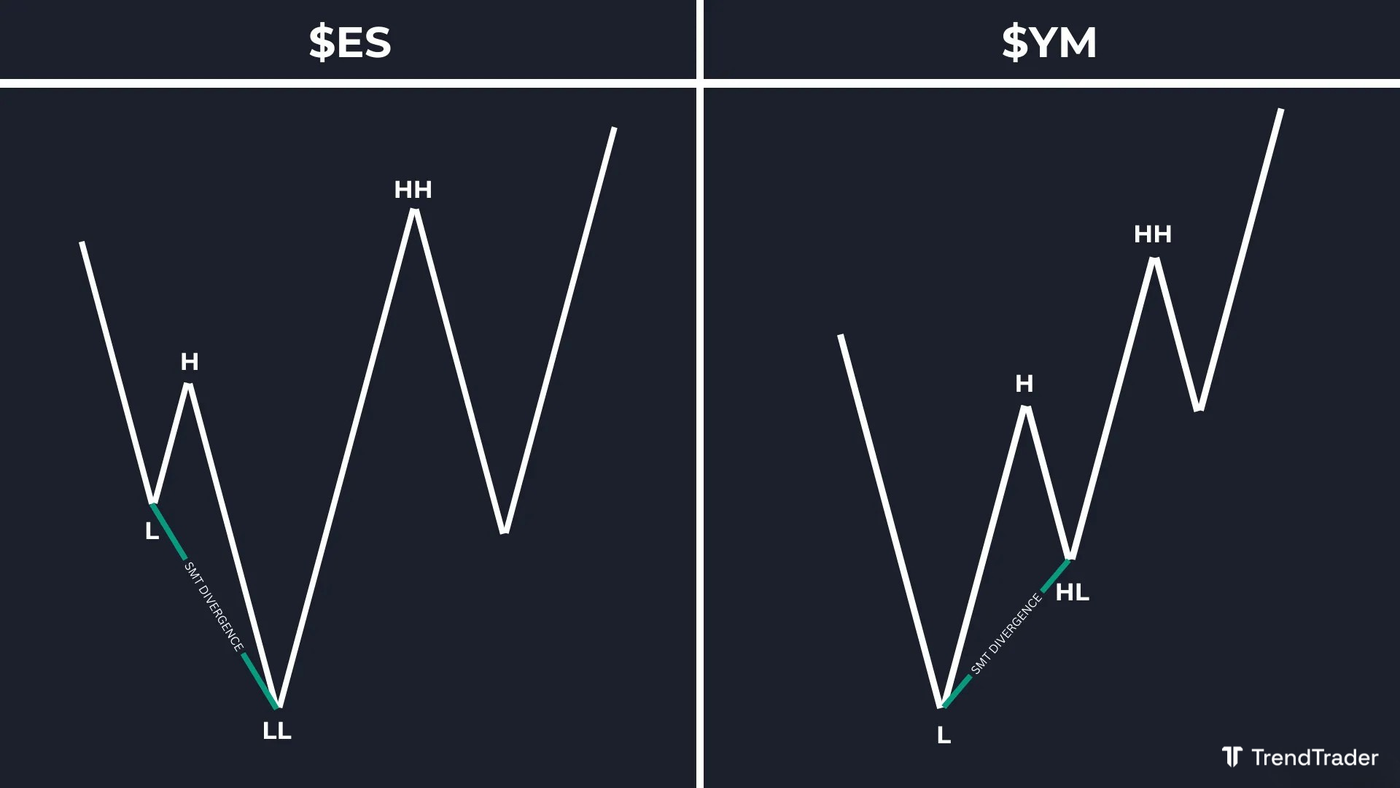
Watch for a sequence where one asset (for example ES, the S&P 500 futures) makes a low, rallies to a high, then makes a lower low. Meanwhile, the correlated asset (for example YM, the Dow Jones futures) makes a low, rallies to a high, then makes a higher low rather than a lower low.
ES made a lower low. YM did not. That divergence is the bullish SMT signal. Draw the divergence line from the first low to the second swing on each chart: a downward line on ES (lower low) and an upward line on YM (higher low). The fact that YM refused to confirm the lower low suggests the breakdown on ES was a liquidity sweep, not a genuine continuation lower.
Bearish SMT Divergence
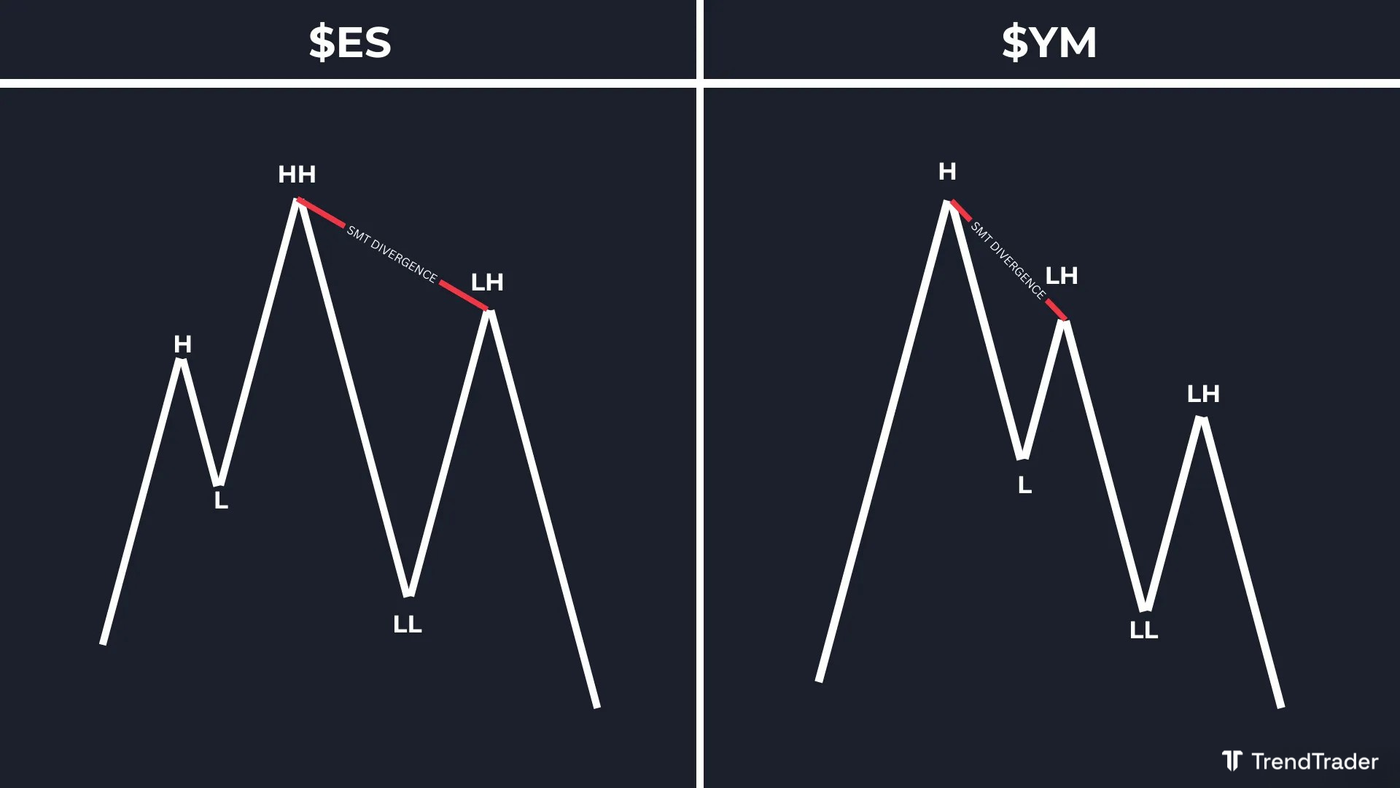
Watch for the mirror sequence. One asset (for example ES) makes a high, pulls back, then makes a higher high. Meanwhile the correlated asset (for example YM) makes a high, pulls back, then makes a lower high rather than a higher high.
ES made a higher high. YM did not. That divergence is the bearish SMT signal. Draw the divergence line from the first high to the second swing on each chart: an upward line on ES (higher high) and a downward line on YM (lower high). YM refusing to confirm the higher high suggests the move on ES was a liquidity sweep of buy stops, not a genuine continuation higher.
How to Trade SMT Divergences
Use SMT divergences as a directional bias signal, not a direct entry trigger. A bullish SMT divergence tells you to look for long setups. A bearish SMT divergence tells you to look for short setups. The entry itself should come from a key level: a fair value gap, an order block, or a liquidity grab at the same zone where the divergence formed.
Long Trade Example
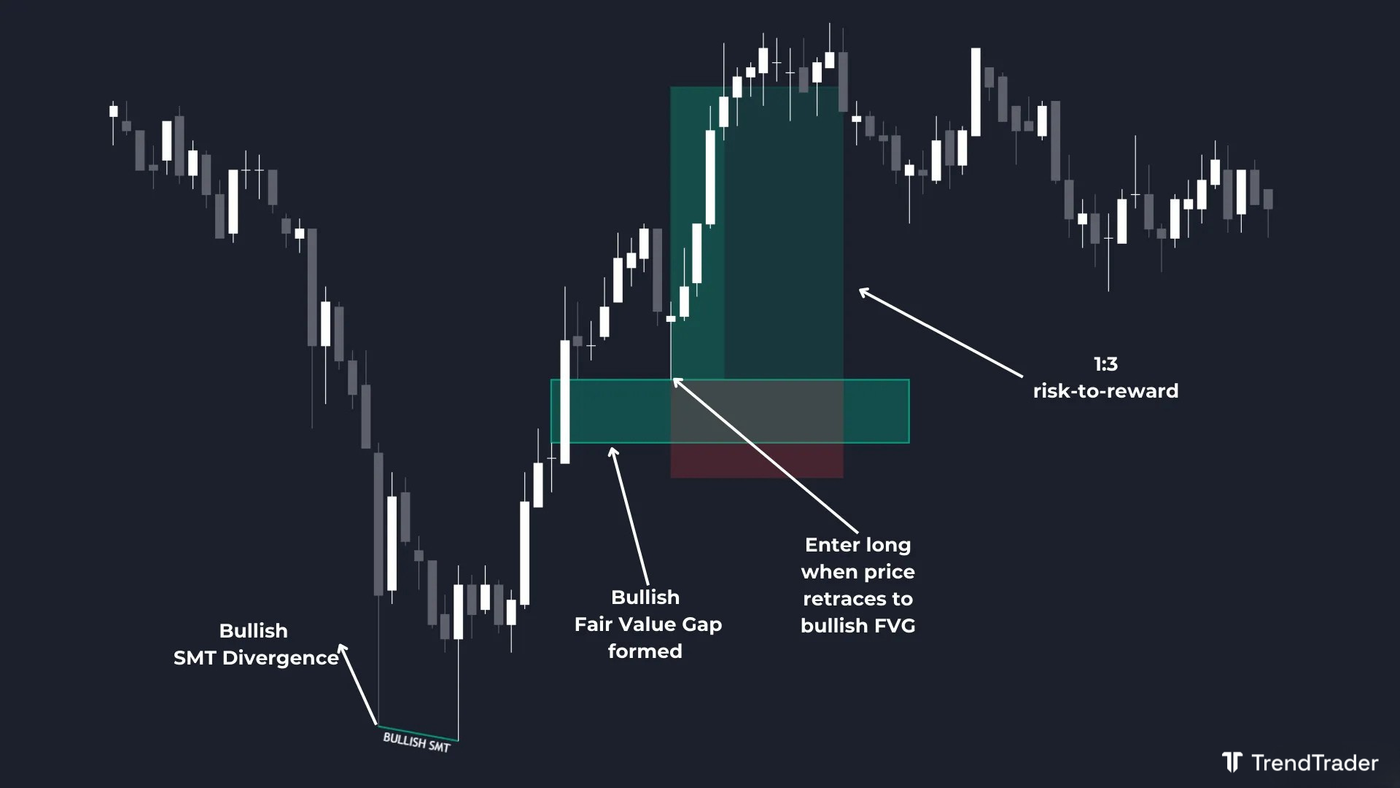
A bullish SMT divergence forms: ES makes a lower low, YM makes a higher low. This gives you a bullish bias. Price then shoots up off the divergence, leaving a bullish fair value gap (FVG) in its wake. Wait for price to retrace into the FVG, enter long, set your stop loss below the gap, and target a higher level. The SMT divergence told you the direction. The FVG gave you the entry.
Short Trade Example
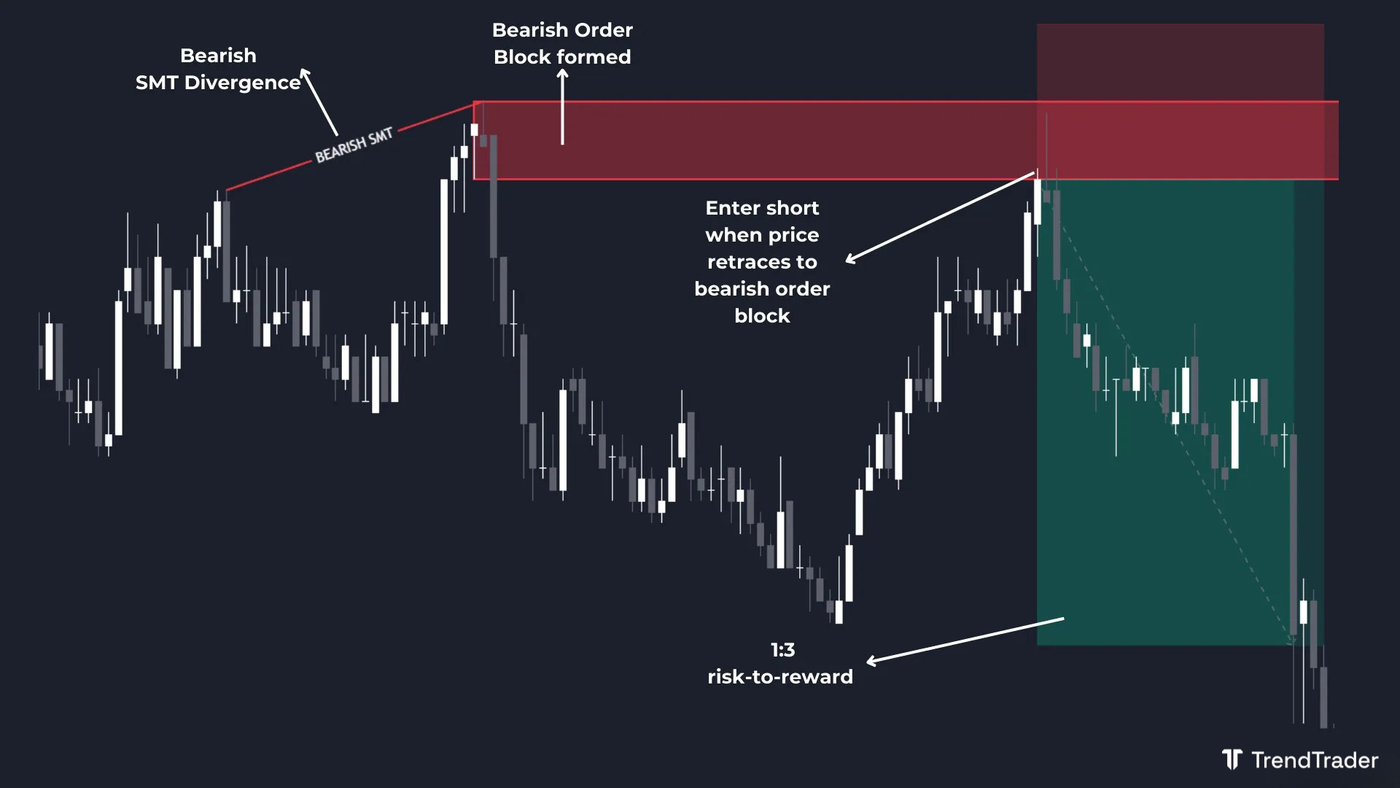
A bearish SMT divergence forms: ES makes a higher high, YM makes a lower high. This gives you a bearish bias. At the same level where the divergence formed, a bearish order block is visible on the chart. Wait for price to retrace into the order block, enter short, set your stop loss above the zone, and target a lower level. The SMT divergence confirmed the bias. The order block gave you the entry.
Can You Trade SMT Divergences Alone?
No. An SMT divergence is a bias signal, not an entry. Trading on the divergence alone without a defined entry level, stop loss, and target turns a useful confluence tool into a guessing game. Always pair it with a specific structure-based entry: a fair value gap, order block, liquidity grab, or a key level where the divergence appears to be clustered.
What Is the Best Timeframe for SMT Divergences?
SMT divergences work across all timeframes and suit all trading styles: scalping, day trading, and swing trading. Higher timeframe divergences (four-hour, daily) carry more weight because they represent a larger pool of participants making the same structural decision. Lower timeframe divergences (five-minute, 15-minute) are valid for intraday setups but should ideally align with a higher timeframe bias.
FAQ
What is an SMT divergence?
An SMT divergence is a discrepancy between the price structures of two positively correlated assets. When one asset makes a new high or low that the other fails to confirm, the divergence can signal a potential market reversal or liquidity sweep.
What assets work best for SMT divergences?
Any two positively correlated assets. Common pairs: S&P 500 and Dow Jones futures (ES and YM), GBP/USD and EUR/USD in forex, Bitcoin and Ethereum in crypto. The tighter the historical correlation, the cleaner the divergence signal when one asset breaks from the pattern.
Is SMT divergence the same as regular divergence?
They share the same concept but differ in application. Regular divergence compares price with an indicator on the same chart. SMT divergence compares price structure across two correlated assets on separate charts. SMT divergences are more visible and do not require an indicator to identify.
This article is for educational purposes only and does not constitute financial advice. Trading involves significant risk of loss. Do your own research and consult a licensed financial advisor before making any trading decisions.
Browse more trading concept guides on the TrendTrader blog.
